Introduction
This year marked the first full year where no fossil-fuel was used directly to power and heat the dwelling, and fuel car travel. In November, the electrical energy storage battery was replaced and upgraded to a Tesla Powerwall 3 with 13.5 kWh of storage capacity. This will provide stored off-peak electricity and solar generation to power and heat the home throughout the day, even in mid-winter, and will eliminate grid electricity use in mid-summer. Total emissions were again reduced further and personally controllable emissions remained negative at -0.5 tCO2e, importantly in a year when global carbon emissions were recorded to have risen again according to the UK Met Office. The carbon fingerprint is shown in Fig.1. in comparison with previous years and baseline.
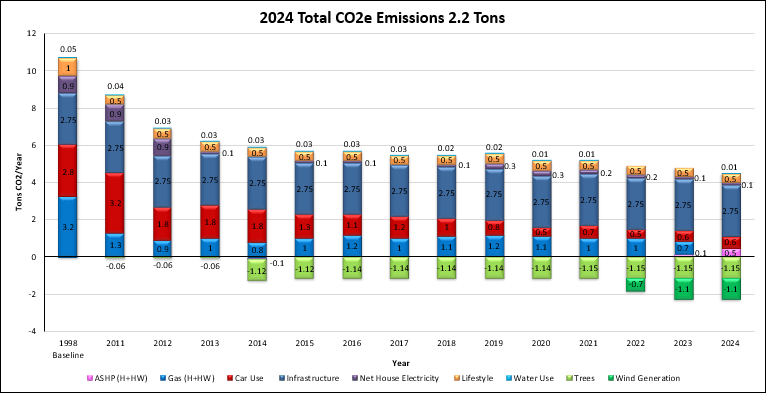
Fig.1. The fingerprint of CO2e emissions in 2024, in comparison with previous years and baseline.
Solar Power Generation
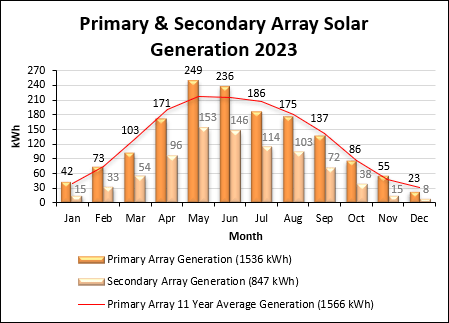
The total solar power generation for the year decreased by 228 kWh to 2155 kWh, derived from reading the generation meters. The primary array data shows that solar irradiance was much lower this year than the 12-year average across the entire year. The monthly solar generation data are shown in Fig.2.
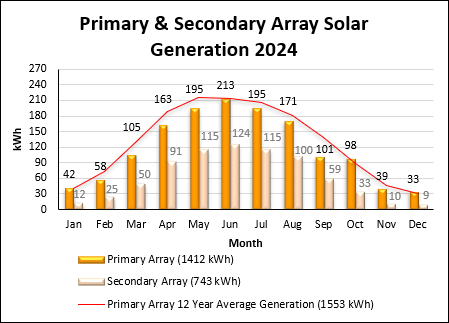
Fig.2. Monthly solar generation data.
Wind Power Generation
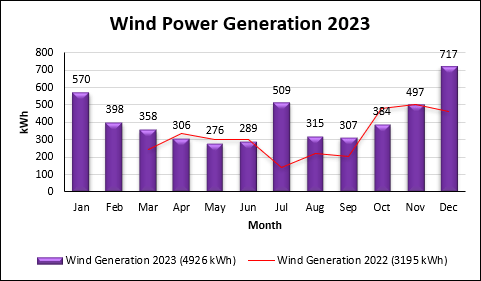
The total wind power generation from my ownership share in the Graig Fatha turbine for this year was 4766 kWh, displacing this amount of conventional grid electricity generation with carbon intensity of 0.225 kgCO2e/kWh (DECC, 2024) for a 2024 generation mix. This resulted in an emission off-set of 1072 kgCO2e or 1.1 tCO2e. The monthly wind generation data were derived from my personal Ripple dashboard, and are shown in Fig.3.
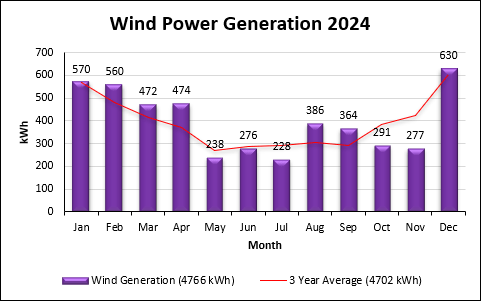
Fig.3. Monthly wind power generation data.
Household Electricity Consumption
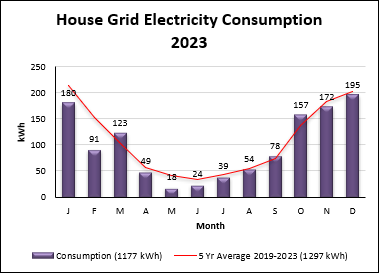
Total annual household electricity grid consumption was reduced on the previous year by 44 kWh or 4% to 1133 kWh, again derived from reading the electricity meter. Consumption was again well below the six-year average, due mainly to the secondary solar array, but also partly to the reduced storage capacity of the battery during the winter months early in the year. The higher storage capacity of the new battery (pictured in Fig.5.) shows increased consumption in the last two months. The higher-than-average consumption in May, August and September corresponds with the very poor solar irradiance in these three months. The monthly grid electricity consumption data are shown in Fig.4.
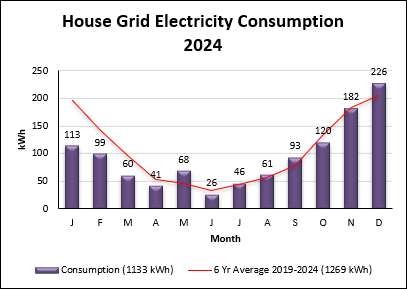
Fig.4. Monthly household grid electricity consumption data.
The Tesla Powerwall 3 Electrical Energy Storage Battery has a storage capacity of 13.5 kWh and a power delivery of 11 kW, facilitating coverage of any power use in the property without the use of the grid during peak hours. The system can also work seamlessly in isolation from the grid during a power outage using a gateway. The improved battery chemistry of Lithium Iron Phosphate (LFP) is more sustainable in production, has increased longevity, and can work within greater temperature extremes, and is a significant upgrade.
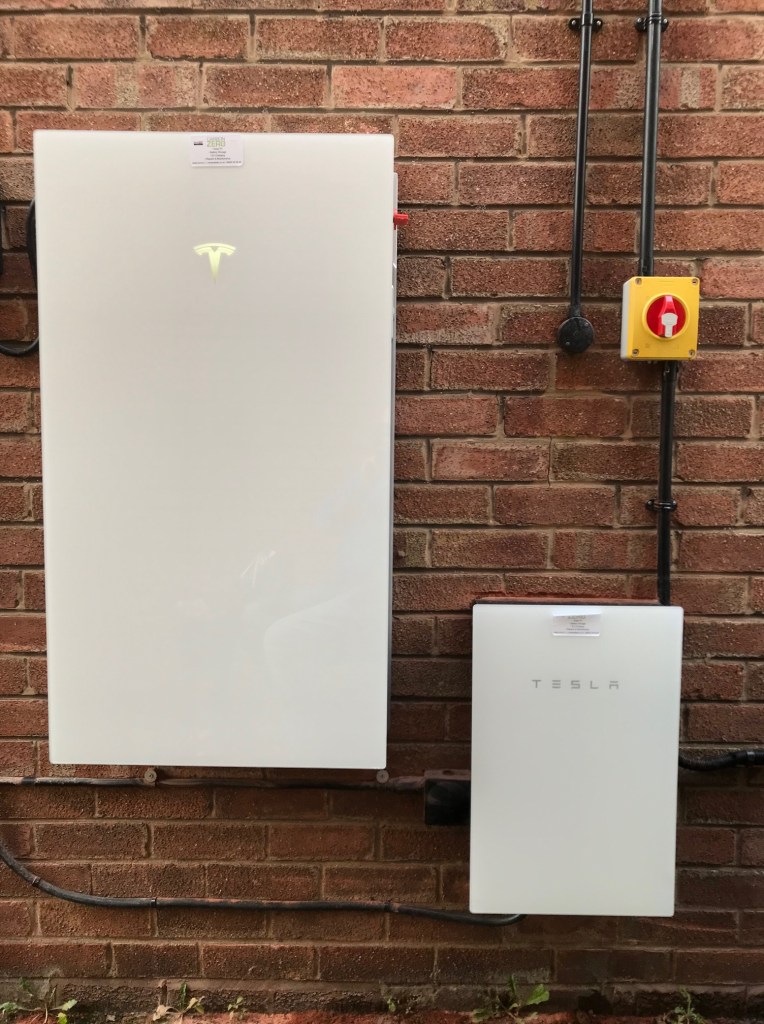
Fig.5. The 13.5 kWh Tesla Powerwall 3 Electrical Energy Storage Battery and gateway.
The assumption was made that only 25% of solar generation was exported, and 75% was consumed on-site, inferred from monitoring system data. Therefore, 1133 kWh grid consumption minus 539 kWh solar export resulted in a net grid electricity consumption of 594 kWh. Grid electricity was given a carbon intensity figure of 0.225 kgCO2e/kWh (DECC, 2024) for a 2024 generation mix. The combined solar self-consumption and exported generation resulted in emissions remaining stable at 134 kgCO2e or 0.1 tCO2e.
Space and Water Heating
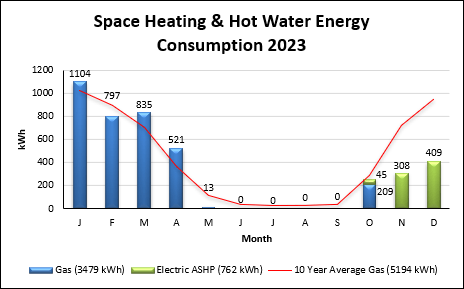
Space heating and water heating was provided by the Mitsubishi Ecodan 5 kW Air-source heat pump (ASHP) for the first full year. The ASHP consumed a total of 2464 kWh of electricity, with 2118 kWh from the grid and the difference supplied by solar power, derived from both a meter and the heating controller, and was given a carbon intensity figure of 0.225 kgCO2e/kWh (DECC, 2024) for a 2024 generation mix. This resulted in 477 kgCO2e or 0.5 tCO2e emissions, approximately half the annual emissions of the gas combi boiler whilst providing more than double the heat and more constant thermal comfort. Importantly, the electrical consumption produced 11056 kWh of heat, giving a coefficient of performance (COP) of 4.01. Essentially, every unit of electrical input delivers 4 units of heat, an efficiency of 400%. For context, a new gas boiler has a real-world efficiency of around 90%, which would only deliver 4675 kWh of heat based on the 10-year average gas consumption in this case. The monthly consumption data is shown in comparison with gas in Fig.6.

Fig.6. Monthly Space & water heating electricity consumption data.
Car Travel
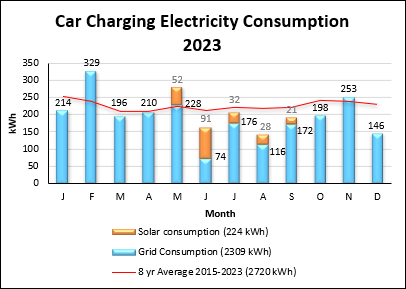
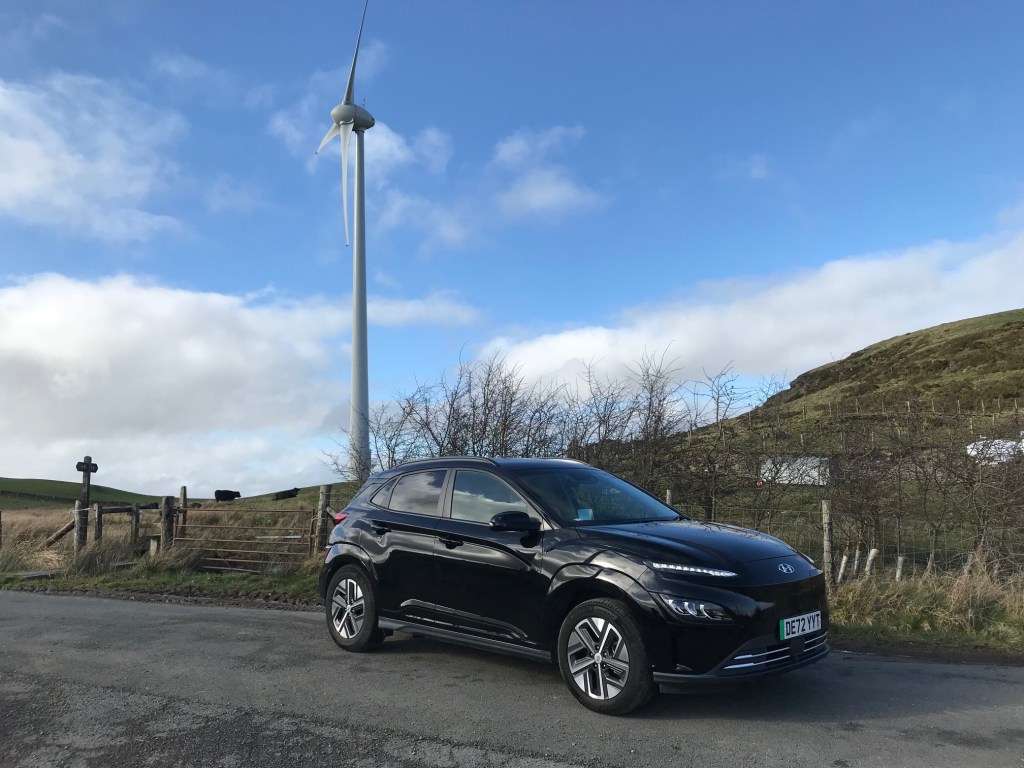
The car in use was a battery electric vehicle (BEV) Hyundai Kona 64-kWh. The annual mileage estimated to the nearest 1000 increased to 13000 miles, or 20500 km. The car was charged in part directly from the solar arrays, and 184 kWh was delivered this way equating to approximately 1200 km. This meant grid consumption was reduced, providing 19300 km of travel. As the fuel is electricity, the carbon intensity figure of fuel production and use in an electric vehicle is the same as is given for grid electricity, which this year was 0.225 kgCO2e/kWh (DECC, 2024) for a 2024 generation mix. The car consumed 2880 kWh of electricity to charge, derived from monthly readings of the night time consumption meter and shown as a column chart in Fig.7., resulting in fuel production emissions only increasing to 615 kgCO2e or 0.6 tCO2e.
Note: In the units previously given for vehicle emissions, 2024 grid electricity equates to 0.03 kgCO2e/km.

Fig.7. Monthly car charging data. (Note: 9-year average excludes 2020 due to pandemic lock-down anomaly).
Water Consumption
Total annual household water consumption increased to 19 m3, derived from a utility bill for that year. The 2024 carbon intensity figure of domestic water supply (0.153 kgCO2e/m3), and treatment (0.186 kgCO2e/m3) is given as 0.339 kgCO2e/m3 (DECC, 2024). This resulted in a 50% increase of 2 kgCO2e to 6 kgCO2e or 0.01 tCO2e emissions. The reason for this increased consumption is not known, and therefore could highlight a potential underground leak or meter issue which is under investigation.
Lifestyle
There were no changes regarding lifestyle in this year, so there was no effect to the results for lifestyle in the carbon footprint calculator (WWF, 2024), and emissions remained at 0.5 tCO2.
Infrastructure
The figure for infrastructure emissions from the carbon footprint calculator remained at 2.75 tCO2 for each UK citizen. The annual donation to the Woodland Trust to plant 25 m2 of woodland, the 14 trees planted, and the green roof and wall off-set and sequester -1.15 tCO2 of these indirect emissions.
Behaviours
There were no behavioural changes in this year, but all previous behavioural changes were maintained. However, the increased storage capacity and power output of the new battery will facilitate more flexibility in electrical power use, for example being able to run several high output appliances at the same time without grid input, if circumstances require it. Previously, this was avoided unless absolutely necessary.
Conclusions
Overall, emissions decreased compared to the previous year by 12% or 0.3 tCO2e, resulting in 79% or 8.5 tCO2e lower annual emissions compared to the baseline year. The ASHP accounted for the decrease, replacing gas for space and water heating, on average halving emissions from this sector. Wind power generation off-set 92% of electricity grid consumption for the home, travel, and space and water heating. This is a great result, considering the share in the wind turbine was matched to provide the consumption of the home and car, but is now also providing most of the heating consumption to.
References
The Department for Energy and Climate Change (2024). Greenhouse gas reporting – Conversion factors 2024. Available at: https://www.gov.uk/government/publications/greenhouse-gas-reporting-conversion-factors-2024 (Accessed 14 January 2025).
WWF, 2025. Footprint Calculator. Available at: https://footprint.wwf.org.uk/ (Accessed 16 January 2025).