Introduction
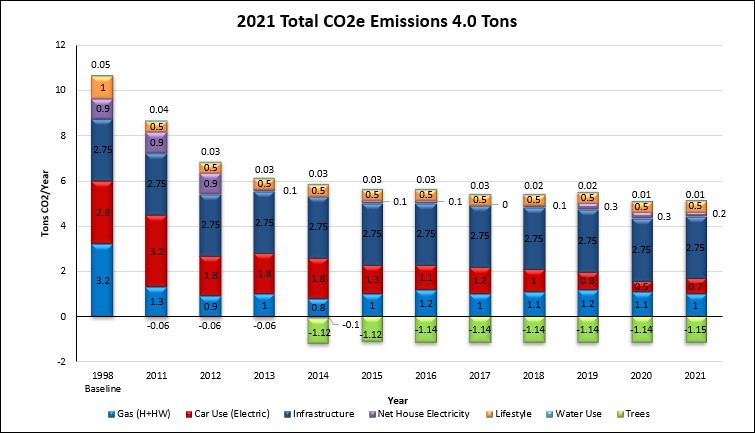
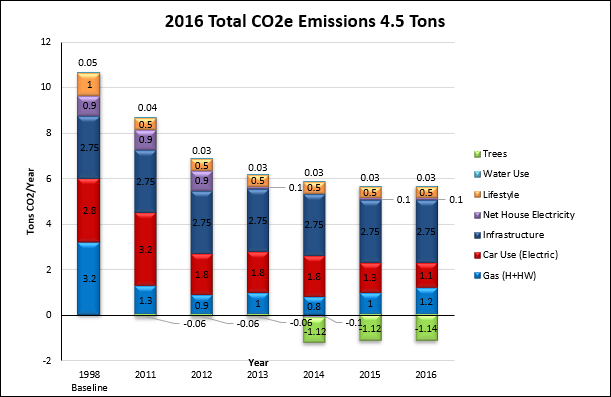
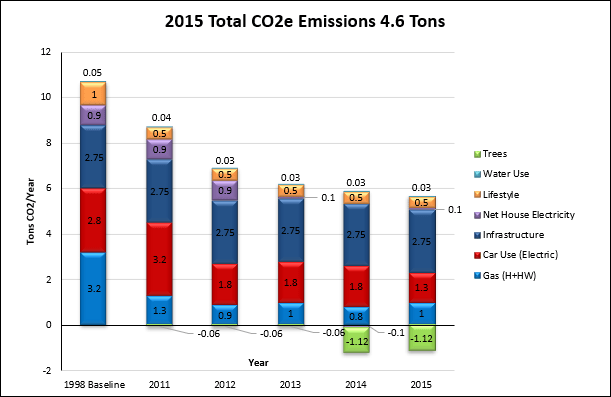
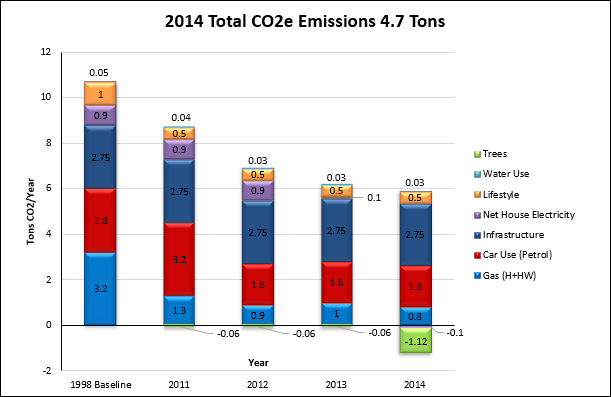
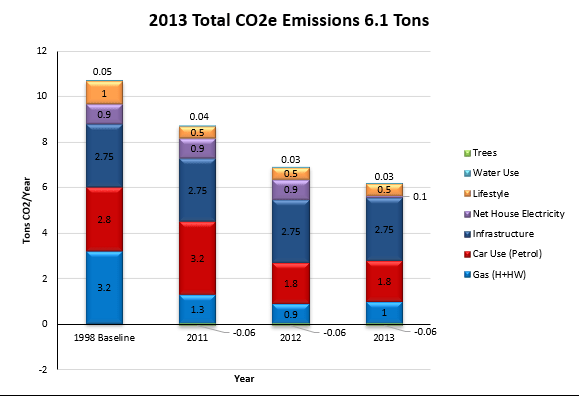
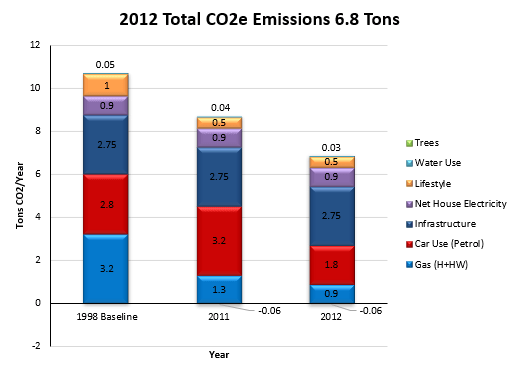
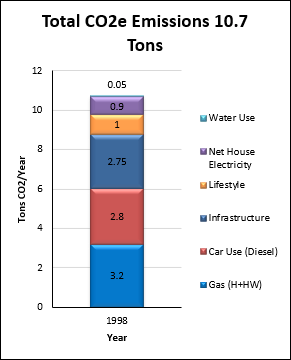
In October this year, an Air-source heat pump was installed, electrifying the space and water heating of the dwelling, and completing the electrification of everything. On November 3rd the gas meter was removed and the supply disconnected. From this moment, the dwelling and travel were 100% fossil-fuel free; net-zero carbon emissions; and net-zero energy bills. In terms of personally controllable emissions, by omitting infrastructure emissions, the value was carbon negative by 0.25 tCO2e. A landmark moment for an average UK dwelling, car mileage, and modern lifestyle. The carbon fingerprint is shown in Fig.1. in comparison with previous years and baseline.

Fig.1. The fingerprint of CO2e emissions in 2023, in comparison with previous years and baseline.
Solar Power Generation
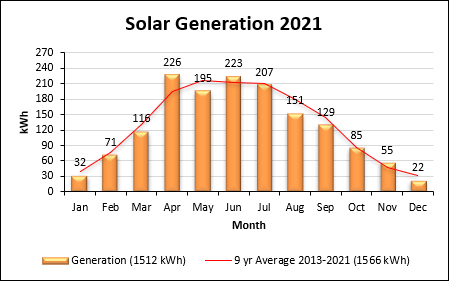
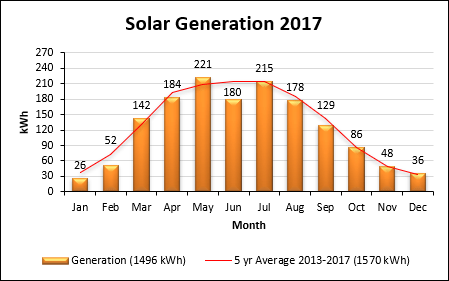
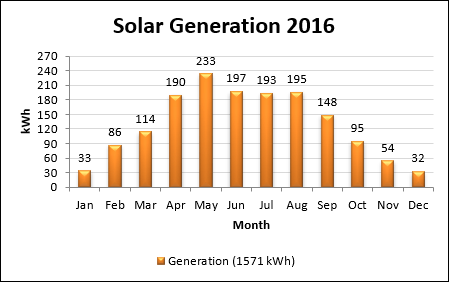
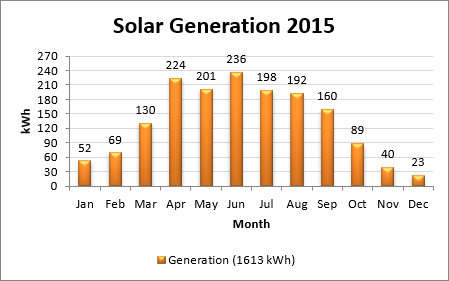
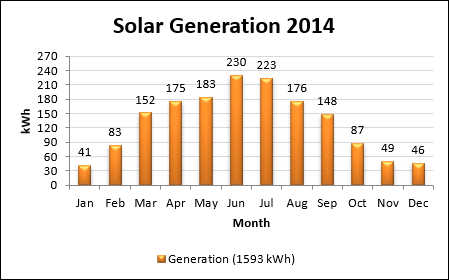
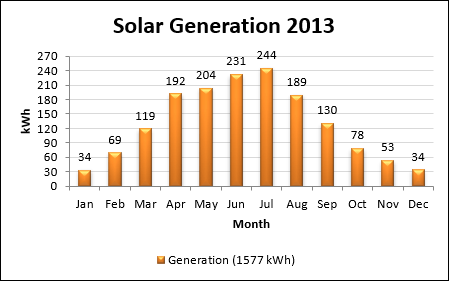
The total solar power generation for the year increased by 422 kWh to 2383 kWh, mainly due to the first full year’s generation from the secondary array, derived from reading the generation meters. The primary array data shows that solar irradiance was lower this year than the 10-year average. The monthly solar generation data are shown in Fig.2.
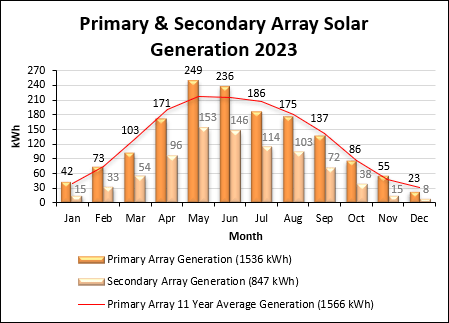
Fig.2. Monthly solar generation data.
Wind Power Generation
The total wind power generation from my ownership share in the Graig Fatha turbine for this first full year was 4926 kWh, displacing this amount of conventional grid electricity generation with carbon intensity of 0.225 kgCO2e/kWh (DECC, 2023) for a 2023 generation mix. This resulted in an emission off-set of 1108 kgCO2e or 1.1 tCO2e. The monthly wind generation data were derived from my personal Ripple dashboard, and are shown in Fig.3.
Consumer-owned Energy Provider Ripple Energy Referral code worth £25: https://rippleenergy.com?ogu=319&rtrfn=Paul-M
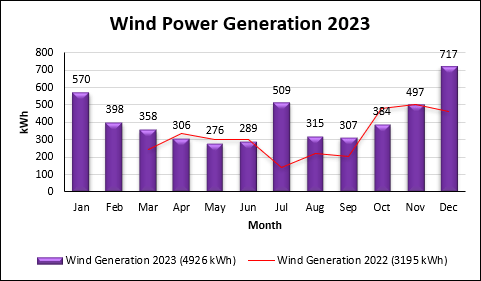
Fig.3. Monthly wind power generation data.
Household Electricity Consumption
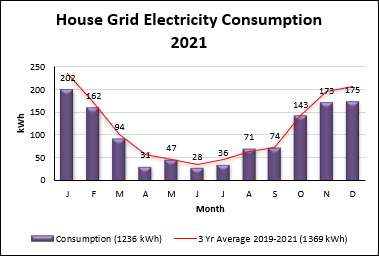
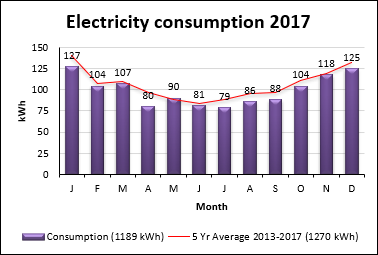
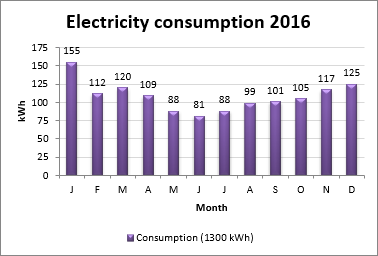
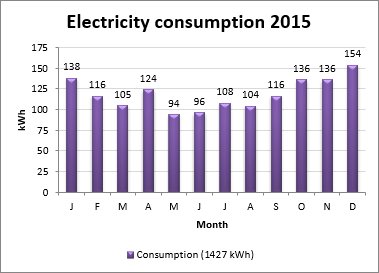
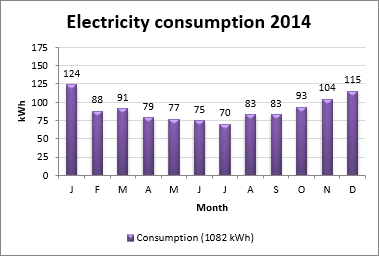
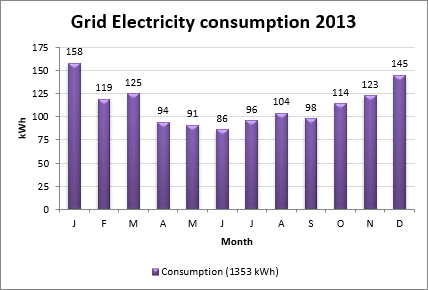
Total annual household electricity grid consumption was reduced on the previous year by 23 kWh or 2% to 1177 kWh, again derived from reading the electricity meter. Consumption this year was well below the five-year average, again mainly due to the secondary solar array. The monthly grid electricity consumption data are shown in Fig.4.
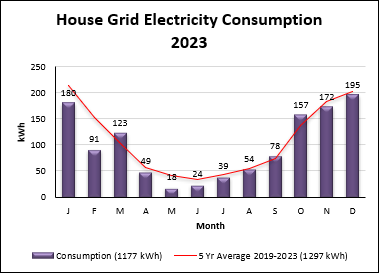
Fig.4. Monthly grid electricity consumption data.
The assumption was made that only 25% of solar generation was exported, and 75% was consumed on-site. Therefore, 1177 kWh grid consumption minus 596 kWh solar export resulted in a net grid electricity consumption of 581 kWh. Grid electricity was given a carbon intensity figure of 0.225 kgCO2e/kWh (DECC, 2023) for a 2023 generation mix. The combined solar self-consumption and exported generation resulted in an emission decrease of 19 kgCO2e to 131 kgCO2e or 0.1 tCO2e.
Green Energy Supplier Octopus Energy Referral code worth £50: https://share.octopus.energy/oak-moose-437
Space and Water Heating
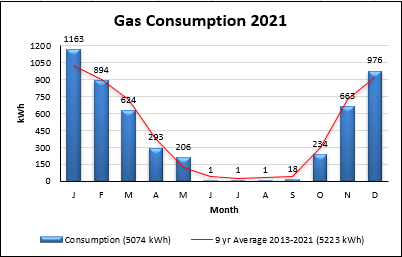
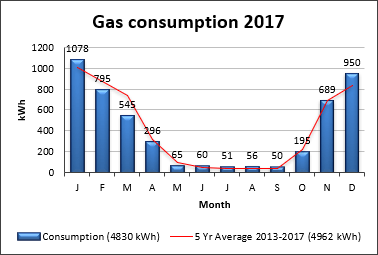
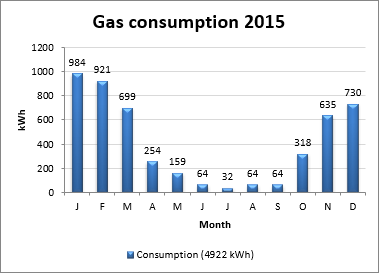
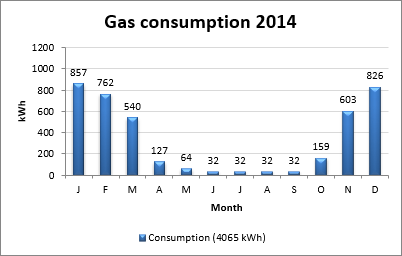
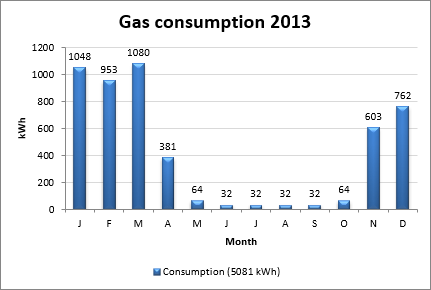
Space heating and minimal water heating was provided by the gas grid between January and October. Total annual household gas consumption decreased by 29% on the previous year to 3479 kWh, derived from monthly meter readings, shown as a column chart in Fig.5., and given a carbon intensity figure of 0.2 kgCO2e/kWh (DECC, 2023). This resulted in a decrease of 289kgCO2e to 696 kgCO2e or 0.7 tCO2e emissions.
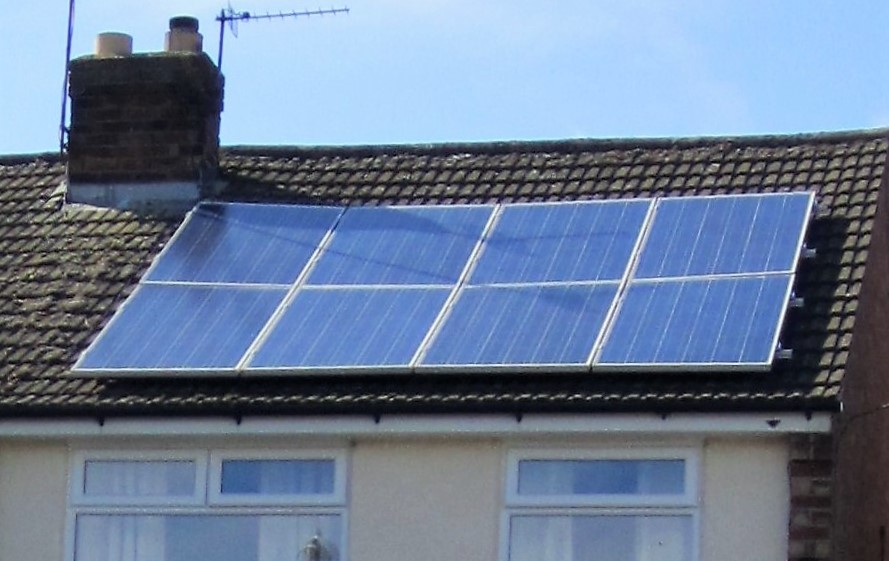
In the last week of October, the Mitsubishi Ecodan 5 kW Air-source heat pump (ASHP), pictured in Fig.6., was commissioned and began providing all space and water heating electrically for the remainder of the year. The ASHP is assumed to consume all the solar generation which is not exported through the winter months, but is supplied mostly by the electricity grid directly, and indirectly by the battery during peak hours. The ASHP consumed 664 kWh of grid electricity, derived from both a meter and the heating controller, and was given a carbon intensity figure of 0.225 kgCO2e/kWh (DECC, 2023) for a 2023 generation mix. This resulted in 149 kgCO2e or 0.1 tCO2e emissions. The consumption is shown in comparison with gas in Fig.5.
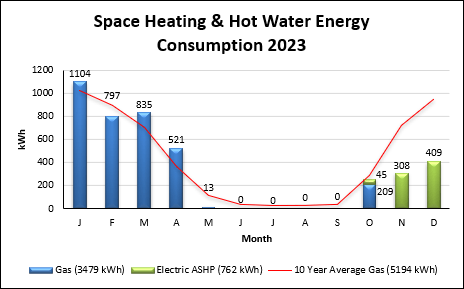
Fig.5. Monthly Space & water heating energy consumption data.
The chart shows how much more efficient the ASHP is, using considerably less energy to provide more heat to the space and water. The house was considerably warmer and more comfortable constantly after the installation. The combination of solar generation, battery storage, and cheap over-night electricity tariff meant the cost was less than gas heating, and these costs were offset by the revenue from the wind turbine and solar Feed-in-Tariff. Net-zero carbon, net-zero cost heating!

Fig.6. The Mitsubishi Ecodan 5 kW Air-source heat pump, located on the side of the property.
Car Travel
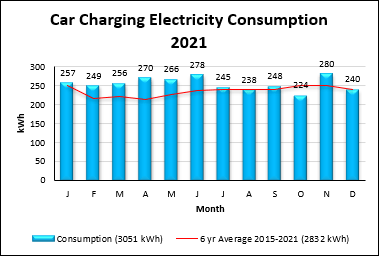
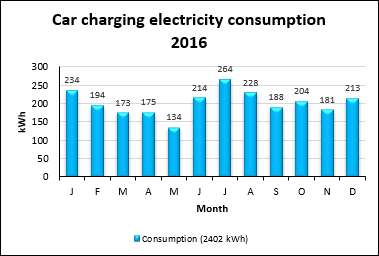
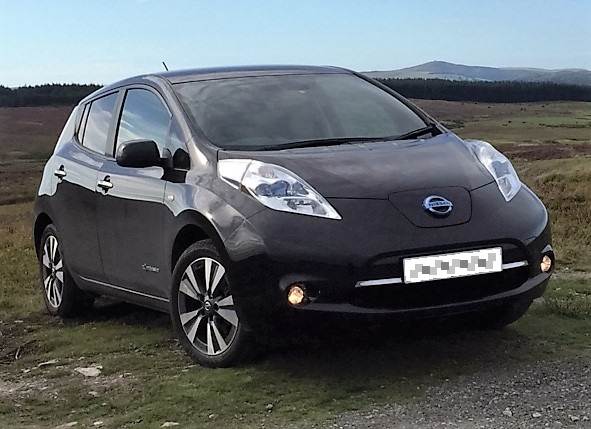
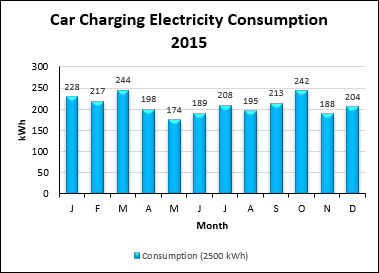
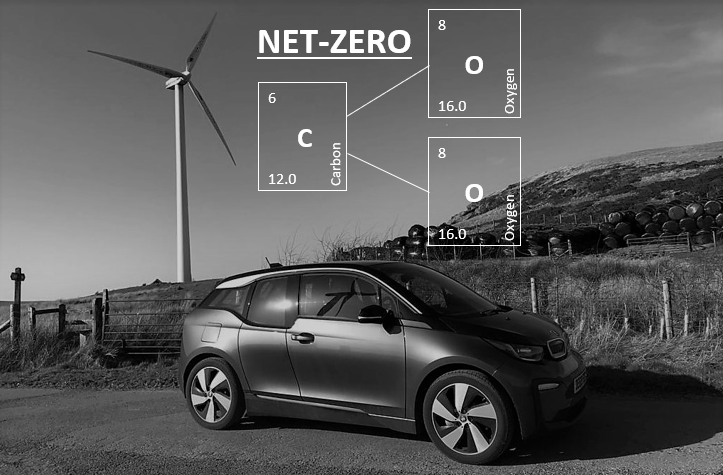
The car in use was a battery electric vehicle (BEV). At the end of 2022, the BMW i3 was changed for a Hyundai Kona, pictured in Fig.8. This car is similar in size to the original 100-mile range 24 kWh battery Nissan Leaf, but has a 64 kWh battery providing up to 350 miles of range on a full charge, demonstrating the improvements in battery chemistry and energy density since 2014. The annual mileage estimated to the nearest 1000 remained at 12000 miles, or 19000 km. However, this year the car was able to be charged directly from the solar arrays, and 224 kWh was delivered this way equating to approximately 1500 km. This meant grid consumption was reduced, providing 17,500 km of travel. As the fuel is electricity, the carbon intensity figure of fuel production and use in an electric vehicle is the same as is given for grid electricity, which this year was 0.225 kgCO2e/kWh (DECC, 2023) for a 2023 generation mix. The car consumed 2309 kWh of electricity to charge, derived from monthly readings of the night time consumption meter and shown as a column chart in Fig.6., resulting in fuel production emissions only remaining at 520 kgCO2e or 0.5 tCO2e.
Note: In the units previously given for vehicle emissions, 2023 grid electricity equates to 0.030 kgCO2e/km.
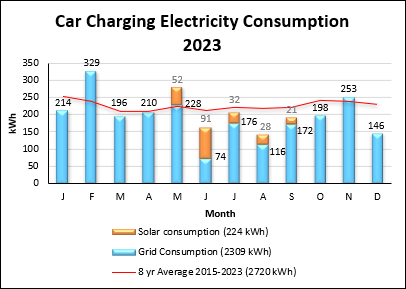
Fig.7. Monthly car charging data. (Note: 8-year average excludes 2020 due to pandemic lock-down anomaly).
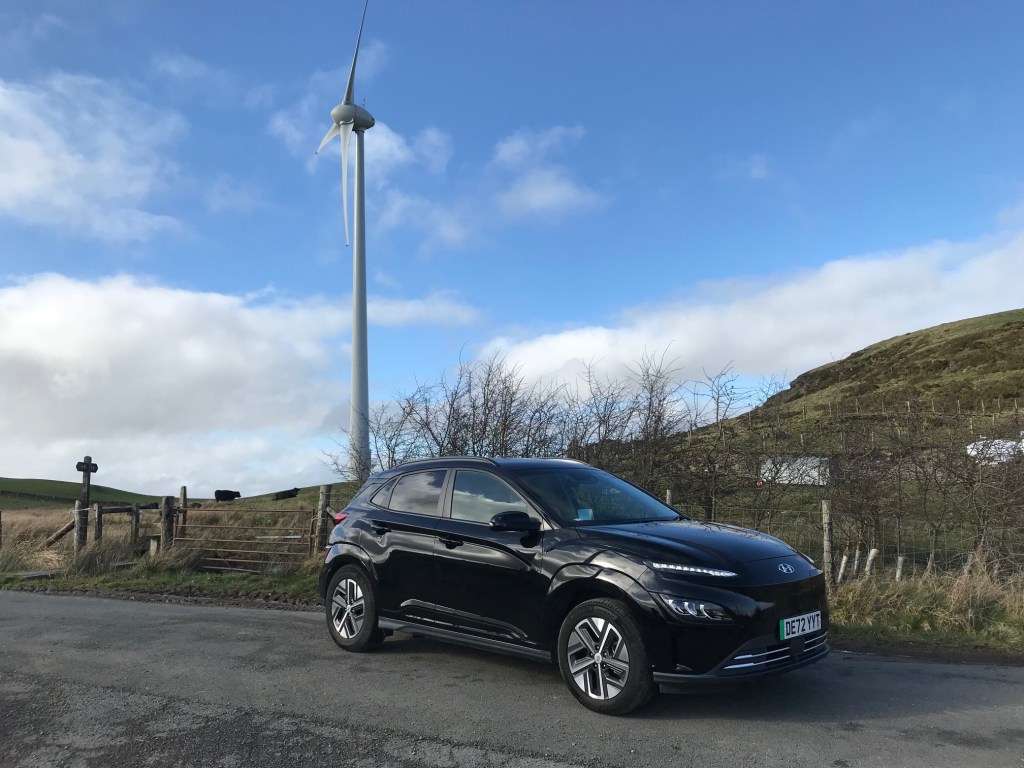
Fig.8. The 64 kWh Battery Electric Hyundai Kona.
Water Consumption
Total annual household water consumption was reduced to 10 m3, derived from a utility bill for that year. The 2022 carbon intensity figure of domestic water supply (0.149 kgCO2e/m3), and treatment (0.272 kgCO2e/m3) is given as 0.421 kgCO2e/m3 (DECC, 2023). This resulted in a 20% reduction of 1 kgCO2e to 4 kgCO2e or 0.0 tCO2e emissions.
Lifestyle
There were no changes regarding lifestyle in this year, so there was no effect to the results for lifestyle in the carbon footprint calculator (WWF, 2023), and emissions remained at 0.5 tCO2.
Infrastructure
The figure for infrastructure emissions in the carbon footprint calculator (WWF, 2023) remained at 2.75 tCO2 for each UK citizen. The annual donation to the Woodland Trust to plant 25 m2 of woodland, the 14 trees planted, and the green roof and wall off-set and sequester -1.15 tCO2 of these indirect emissions.
Behaviours
The addition of the Air-source heat pump required some adjustment to the use of the electrical energy storage (EES) battery. During the winter months, the battery was now charged every night at off-peak rate to discharge and power the heat pump during peak-time periods during the day and evening. It should also be noted that the lead-acid battery after five years of use had, expectedly, reduced in storage capacity by 0.5 kWh. Increased electricity consumption from the heat pump, and reducing battery storage capacity would require a battery upgrade in the next year.
Conclusions
Overall, emissions decreased compared to the previous year by 19% or 0.6 tCO2e, resulting in 77% or 8.2 tCO2e lower emissions compared to the baseline year. A reduction in gas consumption through replacement in the last quarter of the year with the ASHP accounted for 0.3 tCO2e of the decrease. For the second successive year, wind power generation completely off-set all electricity grid consumption for both the home and travel, and this year that included the power consumption of the heat pump for space and water heating, also providing an excess and the remaining 0.3tCO2e reduction through displacing emissions from the National Grid.
References
The Department for Energy and Climate Change (2023). Greenhouse gas reporting – Conversion factors 2023. Available at: Greenhouse gas reporting: conversion factors 2022 – GOV.UK (www.gov.uk) (accessed 17th December 2023).
WWF-UK (2023). Available at: WWF Footprint Calculator (accessed January 2023).