Overview
At the end of 2014, the petrol hybrid vehicle was changed for a full battery electric vehicle (BEV), the Nissan Leaf (24kWh battery capacity), to further reduce travel emissions and eliminate tailpipe emissions completely. Electric vehicles are also an essential part of the sustainable energy transition, providing the storage of excess wind power generation, and reducing its curtailment as more is added to the grid system.
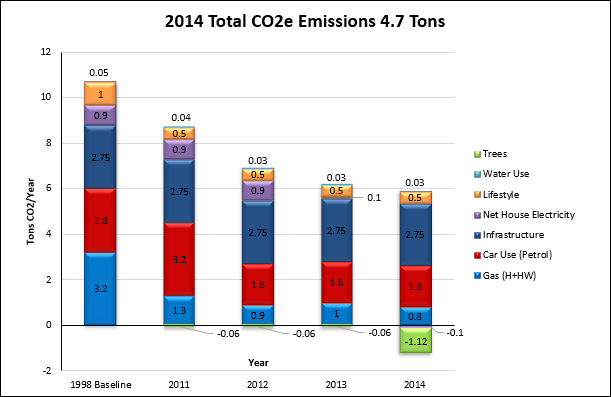
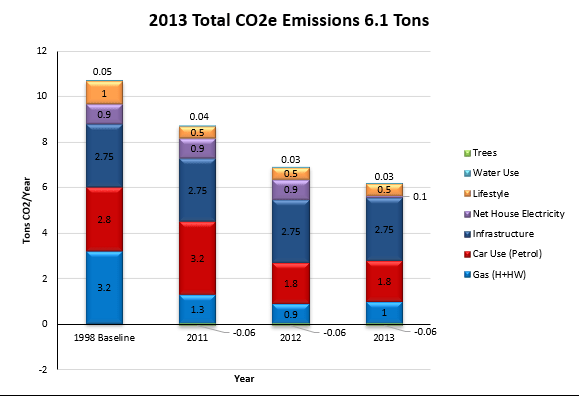
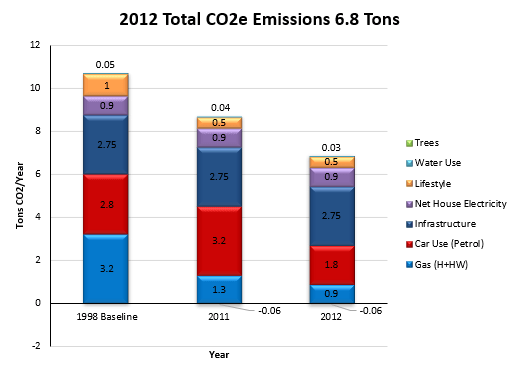
This 2nd generation of the first mass produced full BEV had a range of 90 miles on one charge. Although this range was low, crucially it enabled me to travel more miles at less cost with lower emissions. At the dwelling, the vehicle was charged on an economy seven tariff, ensuring lower cost, and charging during off-peak time at night when grid electricity is greener. The carbon fingerprint is shown in Fig.1. in comparison with previous years and baseline.
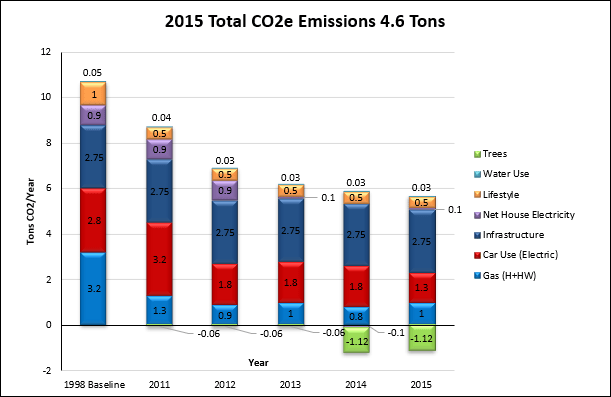
Fig.1. The fingerprint of CO2e emissions in 2015, in comparison with previous years and baseline.
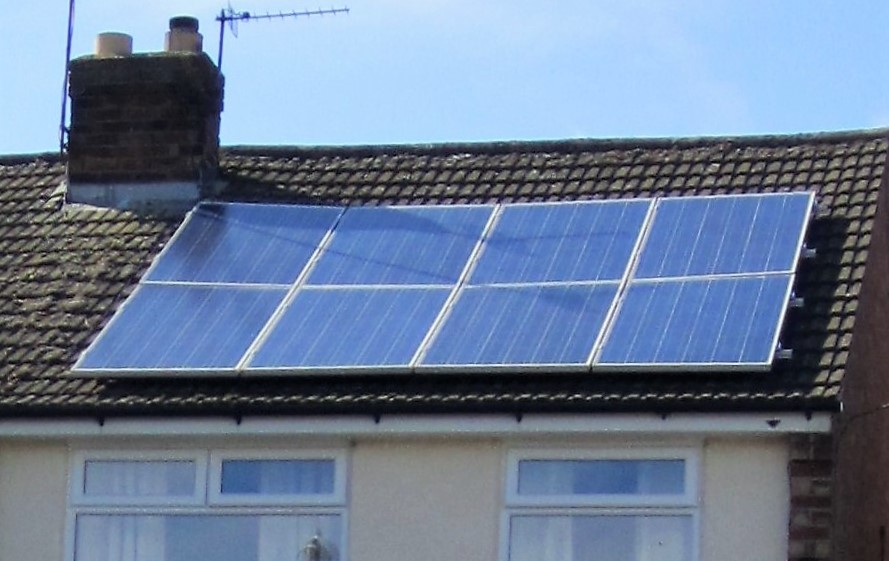
Solar Power Generation
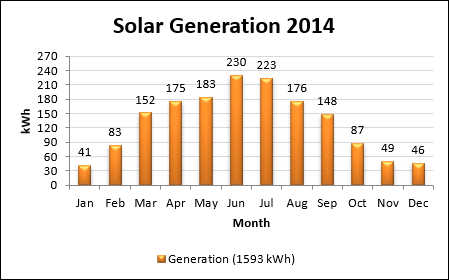
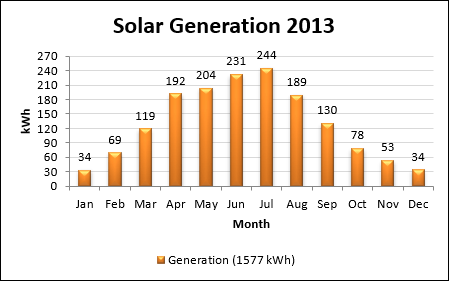
The total solar power generation for the year increased slightly by 20 kWh to 1613 kWh, derived from reading the generation meter. The monthly solar generation data are shown in Fig.2.
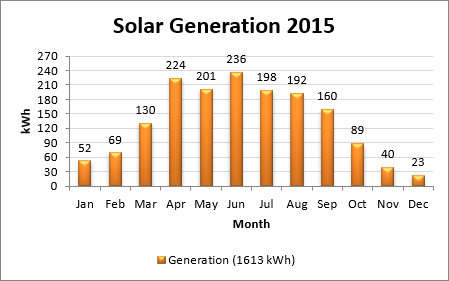
Fig.2. Monthly solar generation data.
Household Electricity Consumption
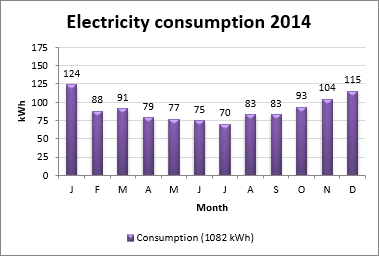
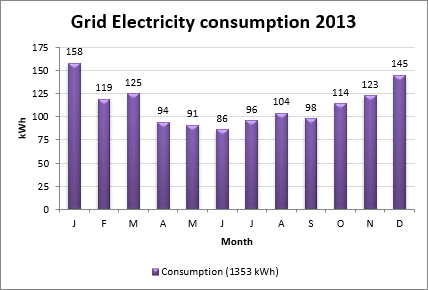
Total annual household electricity grid consumption increased on the previous year by 345 kWh or 32% to 1427 kWh, again derived from reading the electricity meter. The monthly grid electricity consumption data are shown in Fig.3.
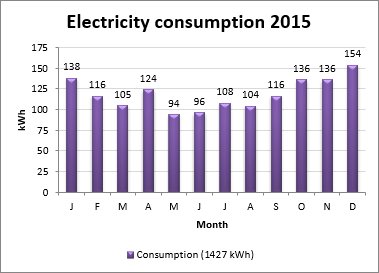
Fig.3. Monthly grid electricity consumption data.
Using the assumption of 25% solar self-consumption, 1427 kWh grid consumption minus 1210 kWh solar export resulted in a net grid electricity consumption of 217 kWh. Grid electricity was given a carbon intensity figure of 0.5 kgCO2e/kWh (DECC, 2015) for a 2015 generation mix. This resulted in an emission increase of 170 kgCO2e to 109 kgCO2e or 0.1 tCO2e.
Space and Water Heating
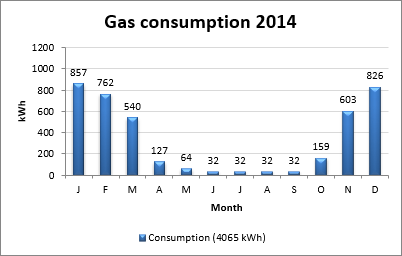
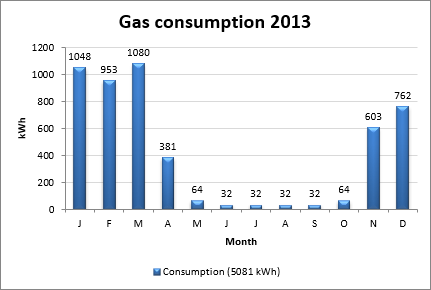
Total annual household gas consumption increased by 21% to a more typical level of 4922 kWh, compared to the previous year’s low, derived from monthly meter readings, shown as a column chart in Fig.4. All consumption was provided by the gas grid, and given a carbon intensity figure of 0.205 kgCO2e/kWh (DECC, 2015). This resulted in an increase of 172kgCO2e to 1009 kgCO2e or 1.0 tCO2e emissions.
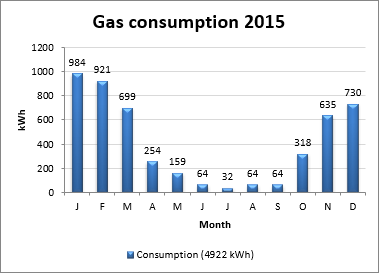
Fig.4. Monthly gas consumption data.
Car Travel
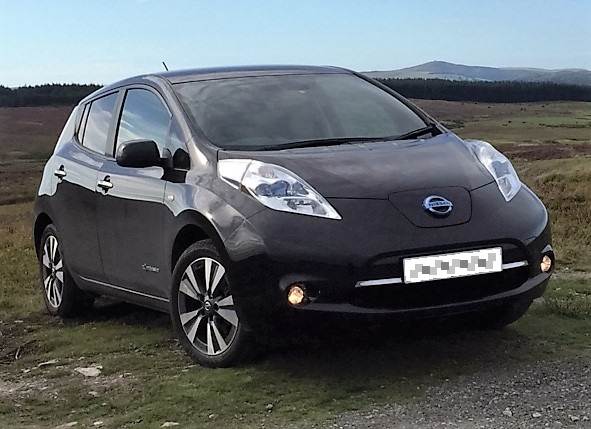
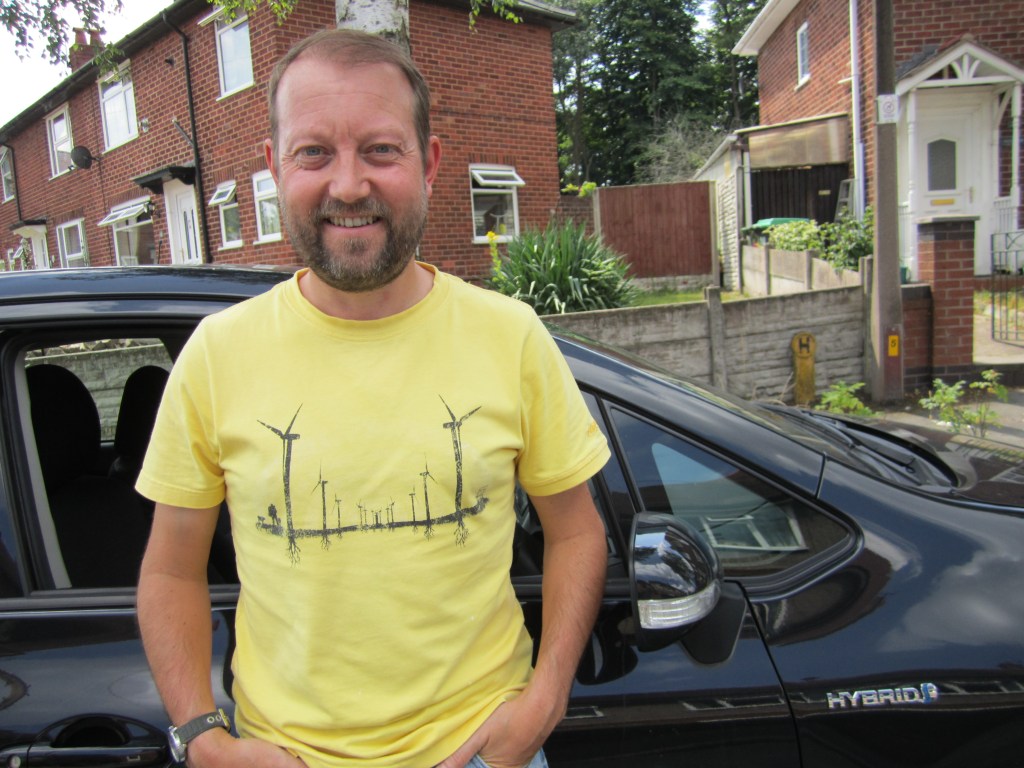
Fig.5. The Battery Electric Nissan Leaf.
The car in use was now a battery electric vehicle (BEV), shown in Fig.5. The annual mileage had also increased by 50% in this year, and estimated to the nearest 1000 was given as 12000 miles, or 19000 km. As the fuel is electricity, the carbon intensity figure of fuel production and use in an electric vehicle is the same as is given for grid electricity, which this year was 0.5 kgCO2e/kWh (DECC, 2015) for a 2015 generation mix. The car consumed 2500 kWh of electricity to charge, derived from monthly readings of the night time consumption meter and shown as a column chart in Fig.6. This resulted in fuel production emissions only, and a reduction of 31% or 570 kgCO2e to 1250 kgCO2e or 1.3 tCO2e.
Notes: Had the mileage remained at 8000 miles, the emission value would have been reduced by 54% to 833 kgCO2e. In the units previously given for vehicle emissions, 2015 grid electricity equates to 0.066 kgCO2e/km.
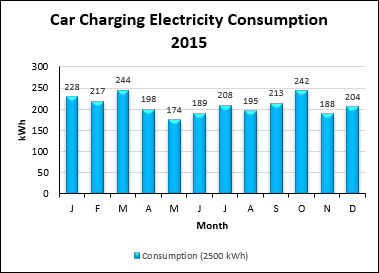
Fig.6. Monthly car charging data.
Water Consumption
Total annual household water consumption increased by 33% to 32 m3, derived from a utility bill for that year. The 2015 carbon intensity figure of domestic water supply (0.344 kgCO2e/m3), and treatment (0.709 kgCO2e/m3) is given as 1.053 kgCO2e/m3 (DECC, 2015). This resulted in an emission increase of 9 kgCO2e to 34 kgCO2e, holding the fingerprint value at 0.03 tCO2e.
Lifestyle
The energy supplier was changed to a different 100% renewable generator, Ecotricity. This provided a better tariff for charging the BEV, and enabled investment in a green bond to fund building of new renewable generation assets like wind and solar farms. A further investment was made in Thrive Renewables for the same reason. These did not affect the results for lifestyle in the carbon footprint calculator (WWF, 2016), so emissions remained at 0.5 tCO2.
Infrastructure
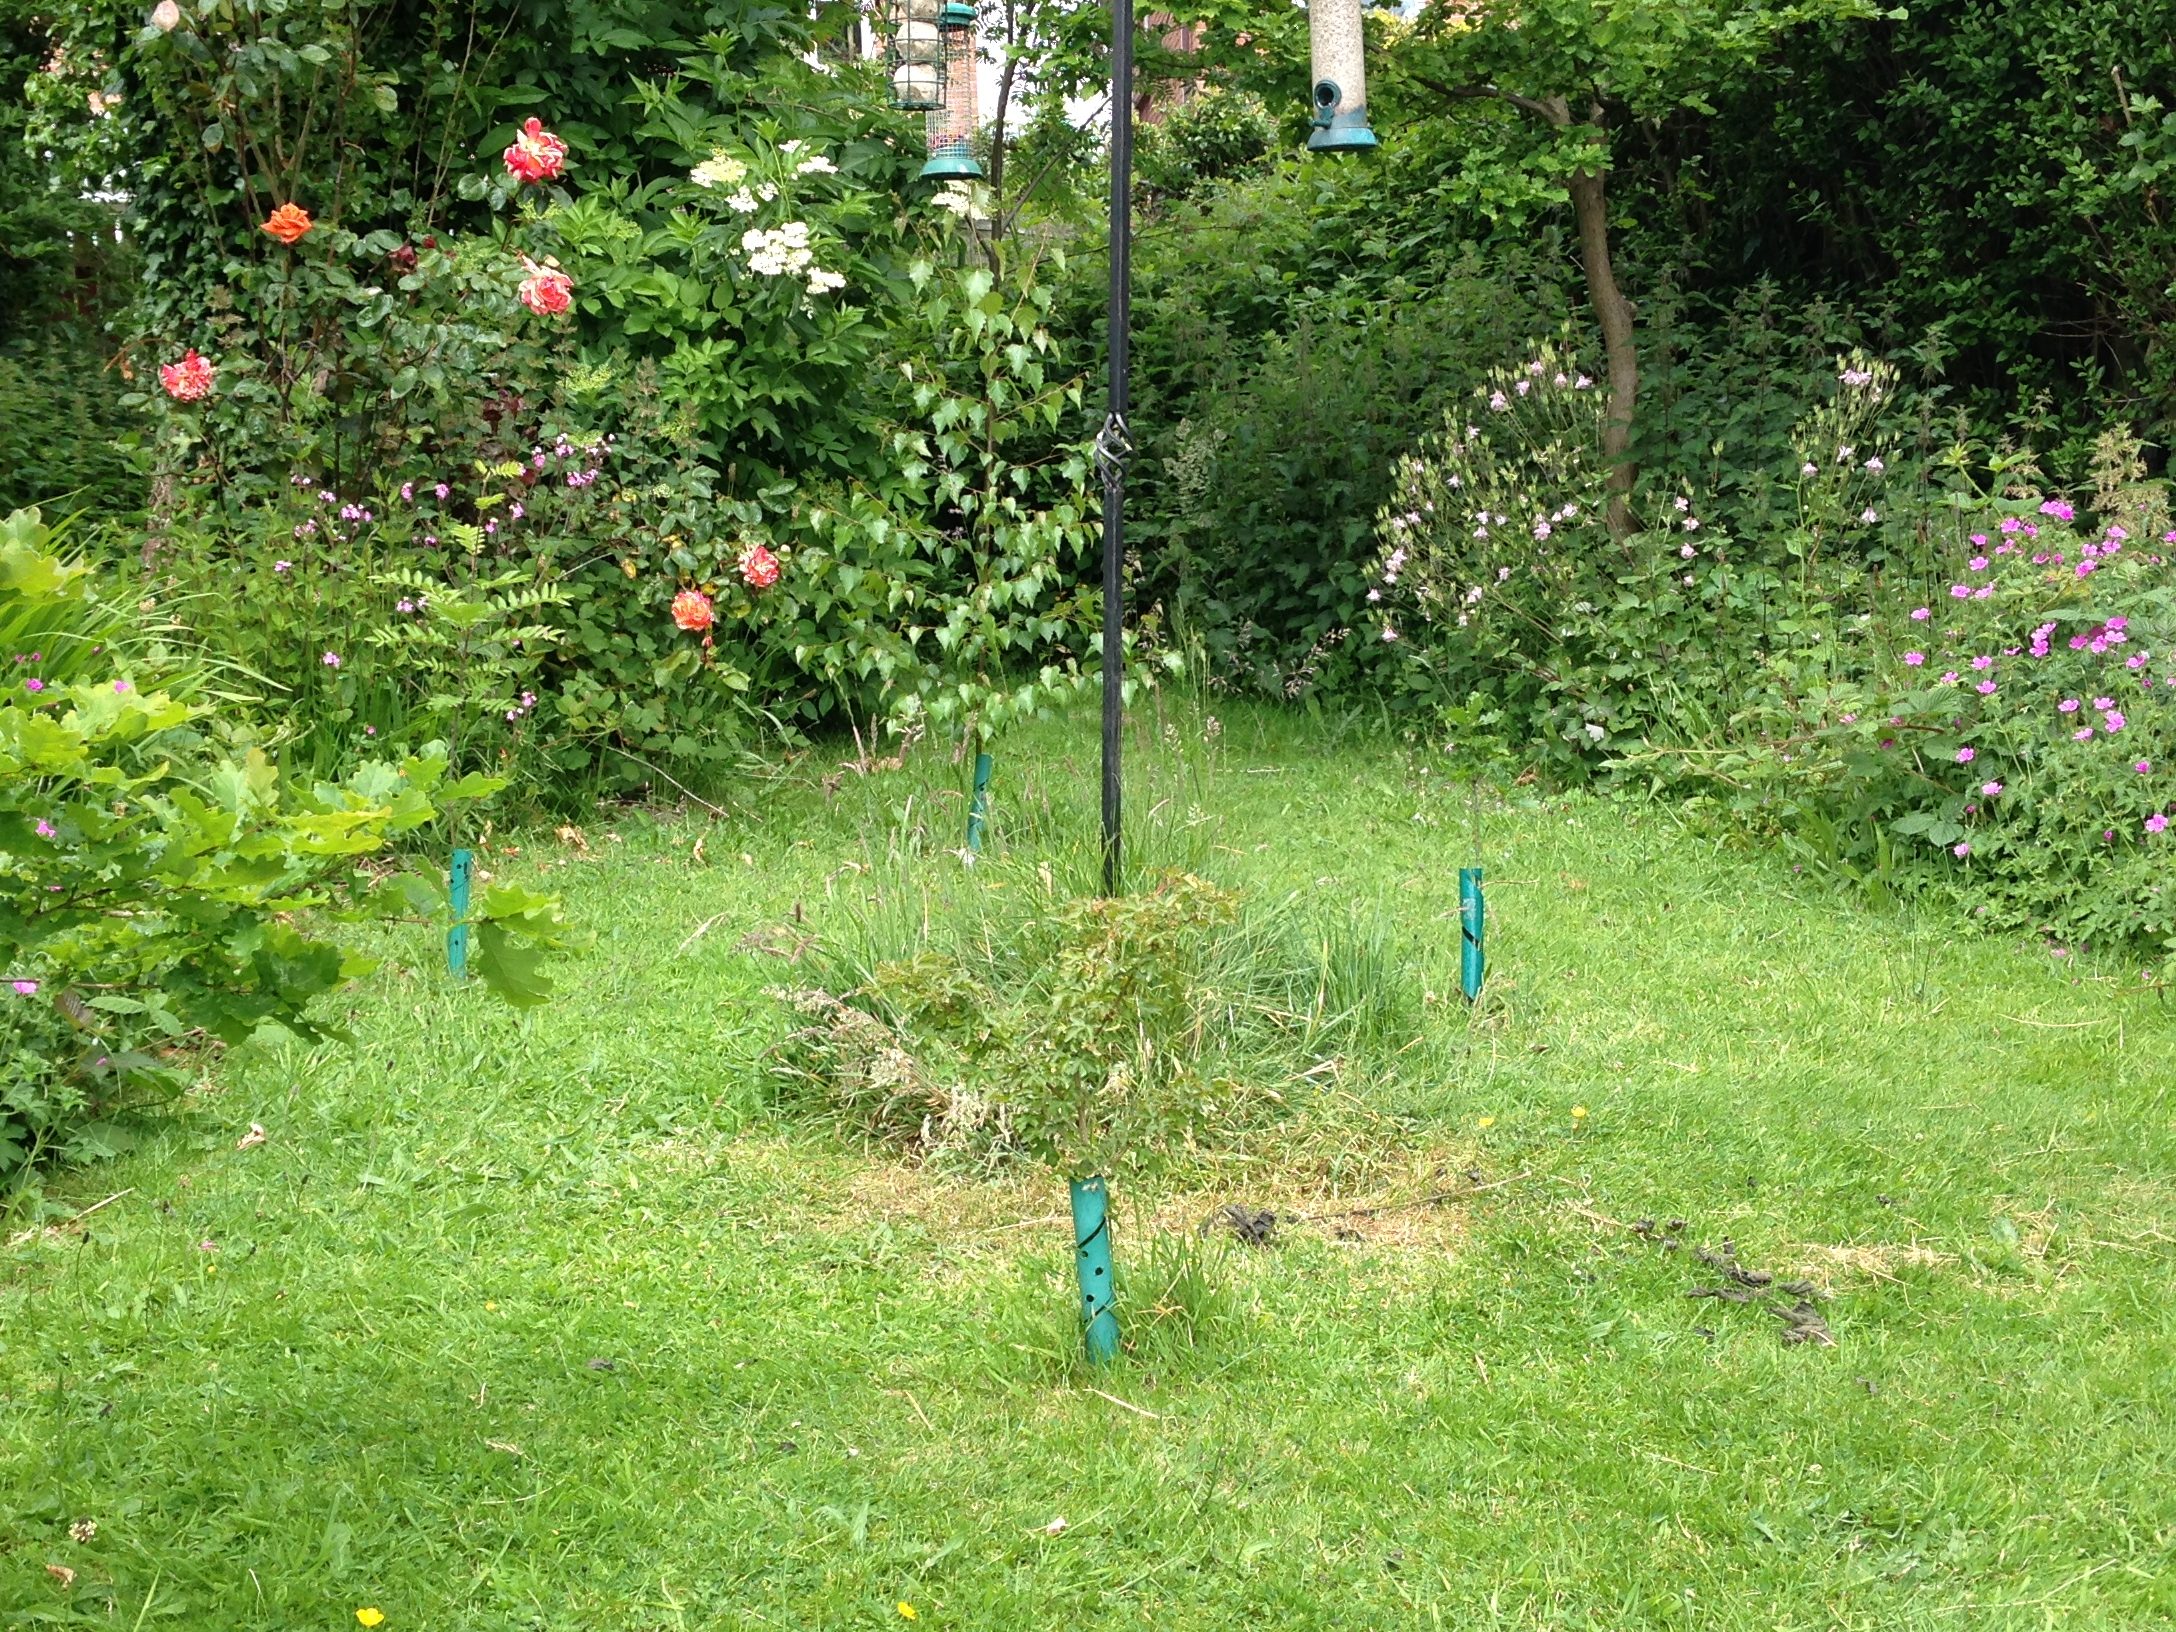
The figure for infrastructure emissions in the carbon footprint calculator (WWF, 2016) remained at 2.75 tCO2 for each UK citizen. The annual donation to the Woodland Trust to plant 25 m2 of woodland, and the 12 trees planted off-set and sequester -1.12 tCO2 of these indirect emissions.
Behaviours
The travel mileage had increased as more time was spent away from home on work placements. Household electricity use increased, possibly due to less time available to use solar power for clothes and dishwashing due to being out during the daytime, and some unintended charging of the EV outside of the off-peak period.
Conclusions
There was an overall emissions reduction of 2% or 0.1 tCO2e compared to the previous year, and 57% or 6.1 tCO2e compared to the baseline year. This was mostly due to the reduction in travel emissions of 0.5 tCO2e, however this reduction was limited by a 50% increase in vehicle mileage, and increases in grid electricity use and gas consumption emissions both of 0.2 tCO2e. There was a further, slight increase in water use, which does not show in the fingerprint.
References
The Department for Energy and Climate Change (2015). Greenhouse gas reporting – Conversion factors 2015. Available at: https://www.gov.uk/government/publications/greenhouse-gas-reporting-conversion-factors-2015 (accessed 05 August 2016).
WWF-UK (2016). Available at: WWF Footprint Calculator (accessed 05 August 2016).