The Net-zero Carbon Home

Introduction

In 2010, I decided to begin making the transition from business-as-usual to a low-carbon, sustainable existence, to try to mitigate my personal contribution to climate change, to be part of the solution and one less part of the problem. This case-study documents what can be achieved in an average UK 1960’s three-bedroom semi-detached house, with a modern but low-impact lifestyle. What follows is a summary of what has been achieved through the activities which can be influenced individually from 2010 to 2024, the second successive year in which Net-zero Carbon was achieved. The full time-line diary with more detail can be viewed in the accompanying text ‘The Road to Carbon-zero,’ on the right-side menu.

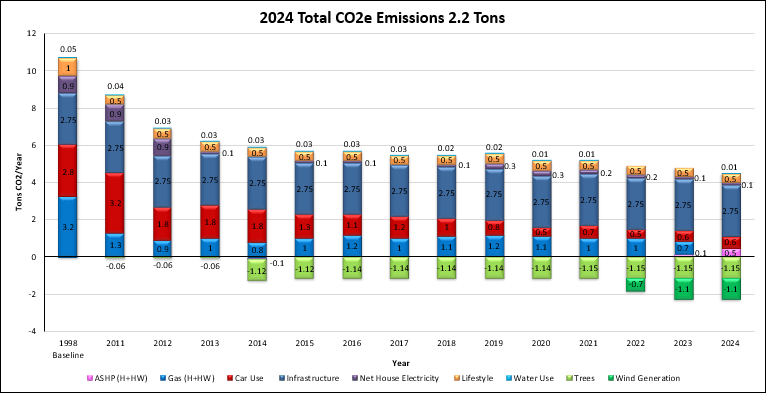
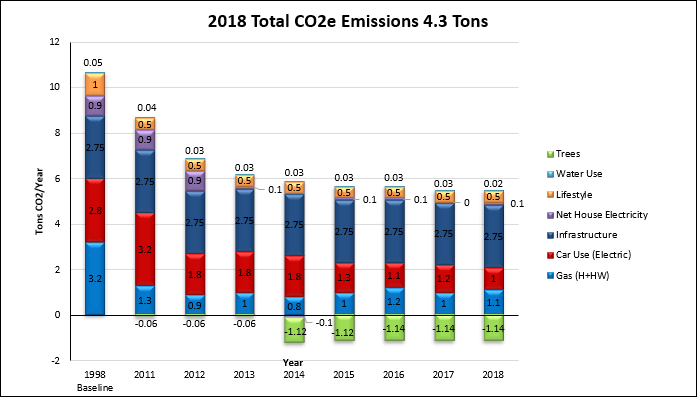
Overall, by 2024 total carbon emissions have been reduced by 79% or 8.5 tCO2e per year compared to the 1998 baseline year, from 10.7 tCO2e to 2.2 tCO2e. For context, this is less than a 2030 global per-capita footprint target aligned with the Paris Agreement somewhere in the region of 2.3 tCO2e (WWF, 2023). Furthermore, personally controllable emissions, omitting infrastructure, produced a carbon negative figure of -0.5 tCO2e per year. The chart in Fig.1. shows the carbon emissions reduction over the period, comparing the total footprint, personally controllable emissions, and the UK per capita target according to The World-Wide Fund for Nature (WWF) carbon footprint calculator. This calculator also suggests the average carbon footprint for my area is 11.3 tCO2e per person.

(Note: The methods used here are just one interpretation of calculating CO2 emissions, it is not exhaustive, it is a general simplification for illustrative purposes).

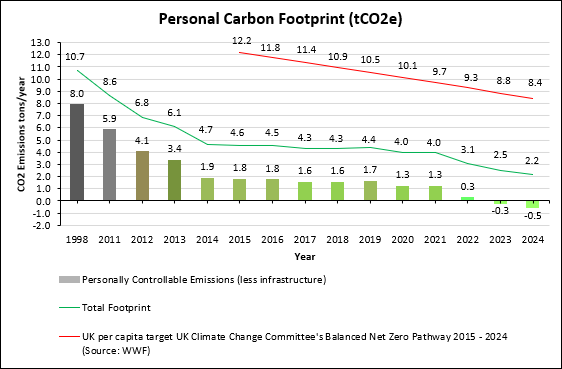
Fig.1. The footprint of Annual CO2e emissions from 2011 to 2024, and including the 1998 baseline.

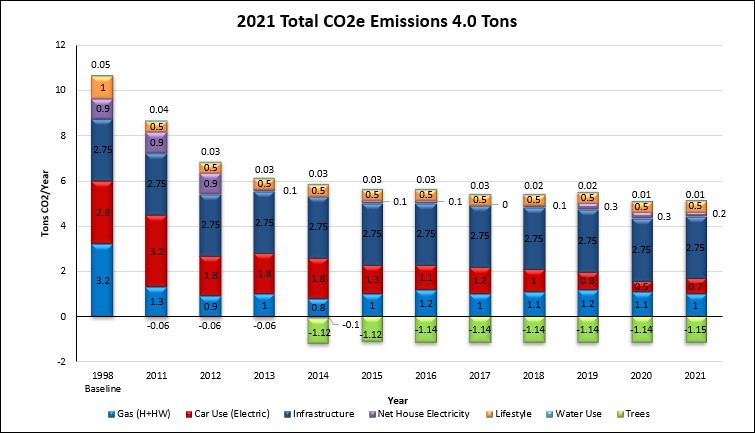
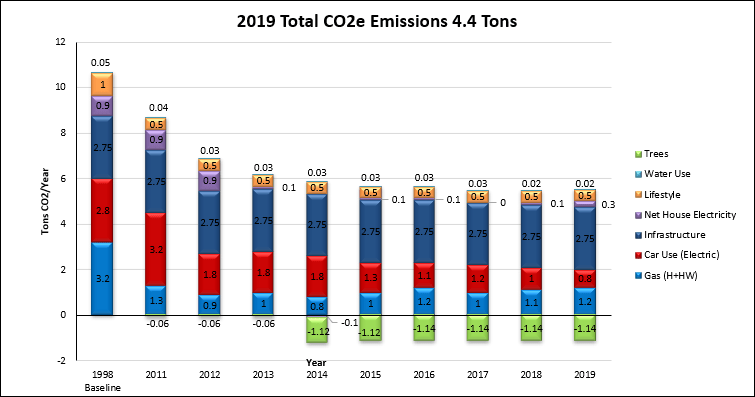
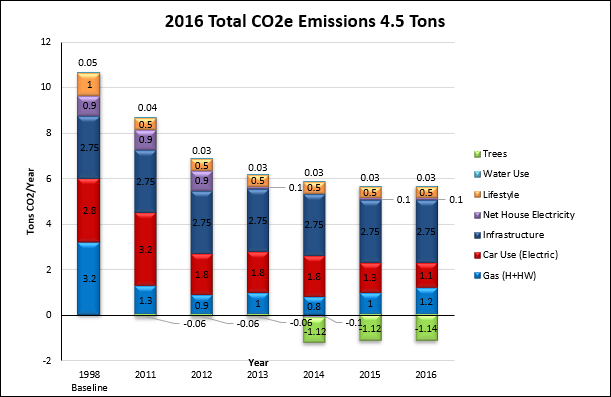
The chart in Fig.2. shows the Carbon Fingerprint, which shows the emission impact over the period from the individual activities which can be targeted for reduction.

Fig.2. The fingerprint of Annual CO2e emissions from 2011 to 2024, and including the 1998 baseline. (Note: Car Use is electric from 2015 – 2024).

Summary of Impacts – 2024 compared to 1998 Baseline year

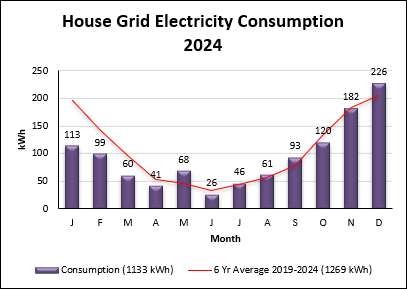
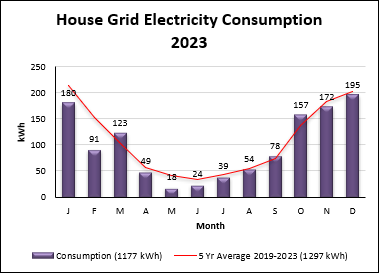
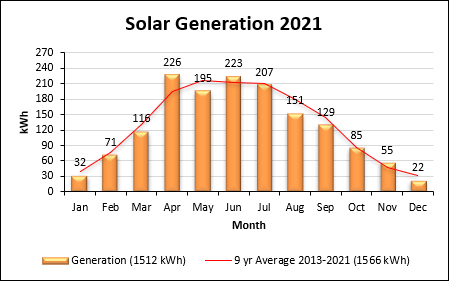
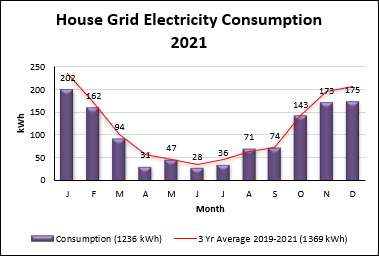
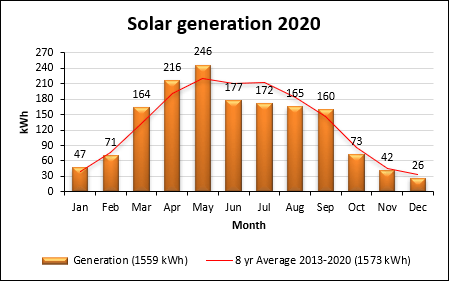
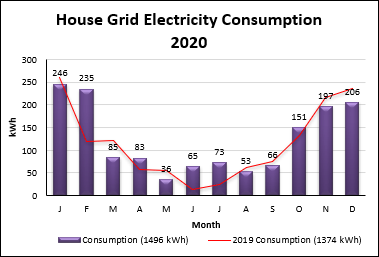
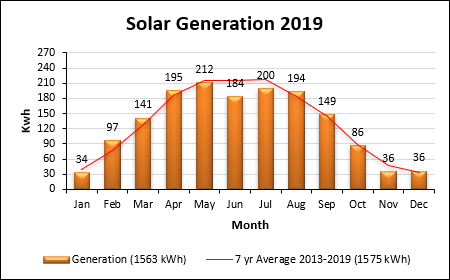
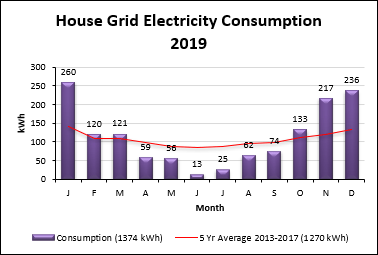
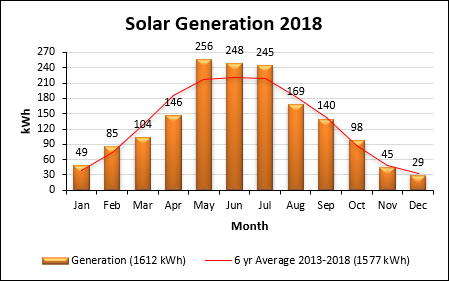
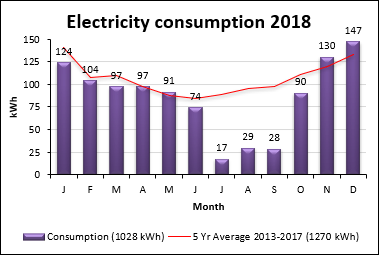
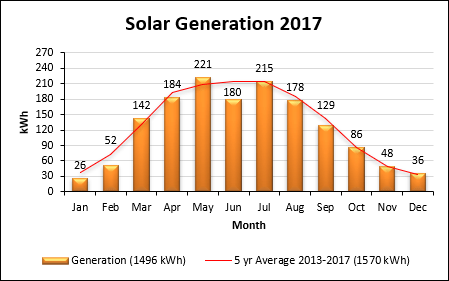
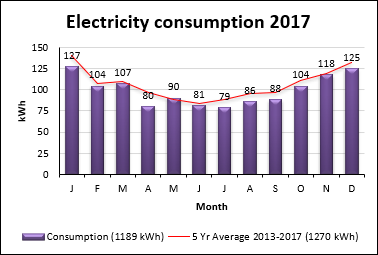
Annual Household Grid Electricity Energy Consumption reduced by 34%, emissions reduced by 0.8 tCO2e/Year, through efficiency and solar power used on-site and exported to the National Grid. Energy storage battery provides load shifting from peak-time to off-peak.

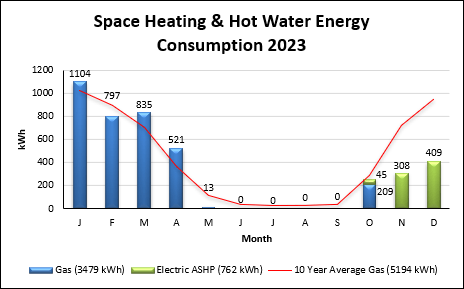
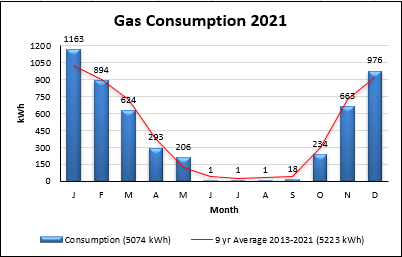
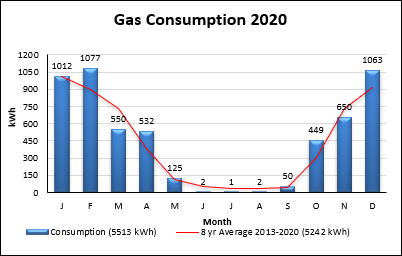
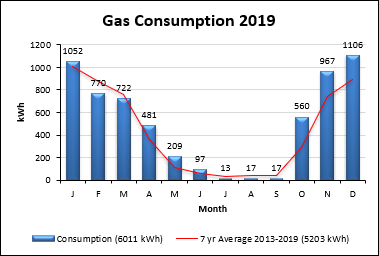
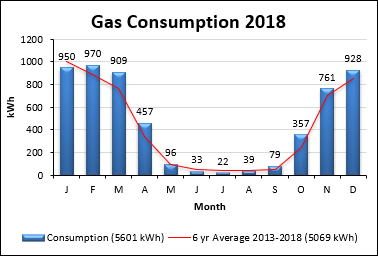
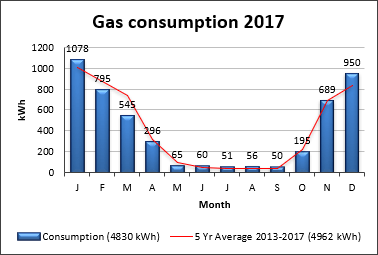
Annual Space and Water Heating Energy Consumption reduced by 84%, emissions reduced by 2.7 tCO2e/Year, through insulation, improved glazing, and more efficient heat sources, initially gas condensing boiler then Air Source Heat Pump.

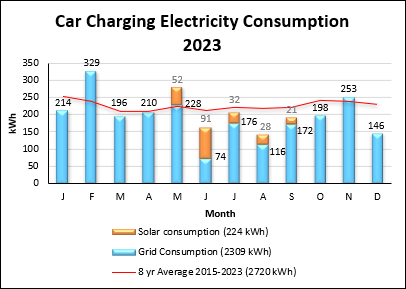
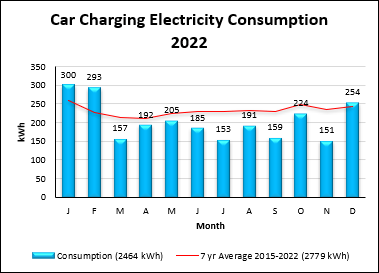
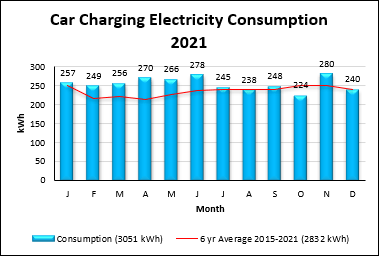
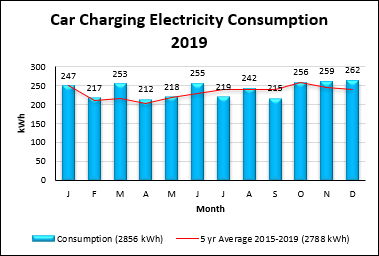
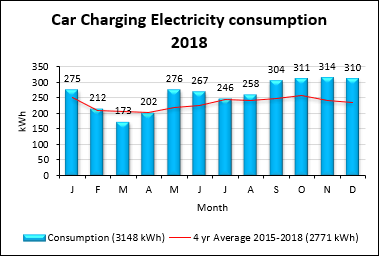
Annual Car Travel emissions reduced by 79% or 2.2 tCO2e/Year through switching from Internal Combustion Engine to Battery Electric power, despite an average increase in mileage of 4000 mile/Year.

Annual Water Consumption reduced by 80%, emissions reduced by 0.04 tCO2e/Year through water harvesting, water efficient appliances, and only using a shower.

Annual Lifestyle emissions reduced by 50% or 0.5 tCO2e/Year through low consumption lifestyle, local and sustainably sourced organic food, a vegan diet, support for several environmental charities, and sustainable, ethical finances.

Annual Infrastructure emissions remain stable for UK citizens at 2.75 tCO2e/Year but personally Offset by 42% or 1.15 tCO2e/Year, through natural sequestration by tree planting.

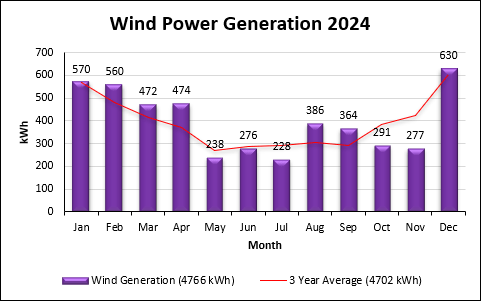
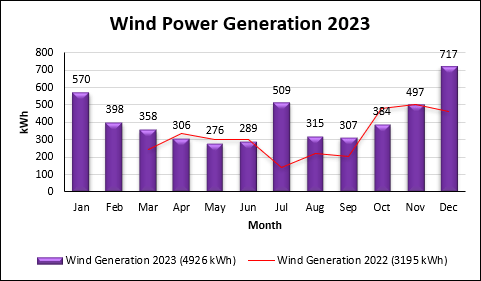
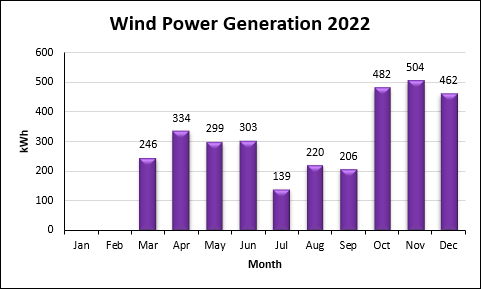
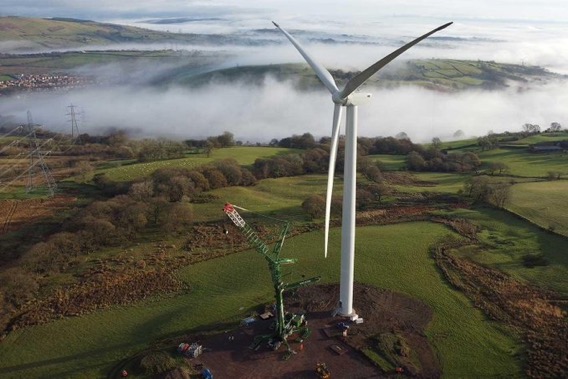
Renewable power generation from a share in the Ripple Energy Graig Fatha Wind Turbine project, the UK’s first consumer-owned renewable energy generation source, displaces fossil-fuel generated emissions from the National Grid. In 2024, this removed 1.1 tCO2e emissions providing off-set for 92% of emissions from my grid electricity use. 

Current Specifications

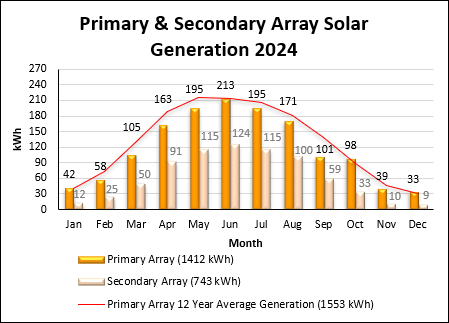
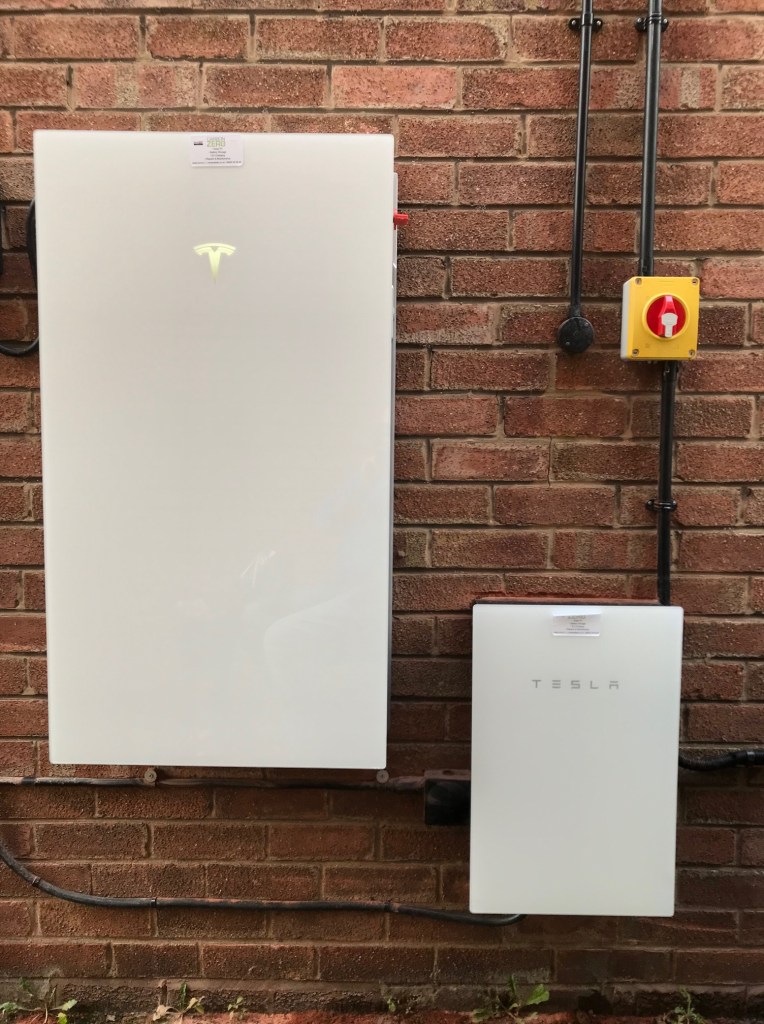
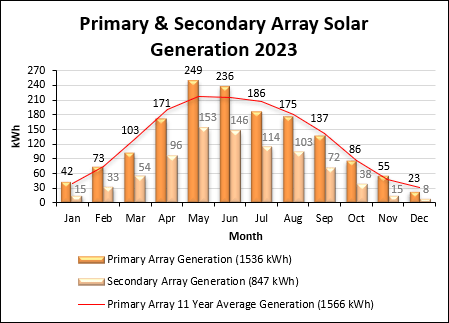
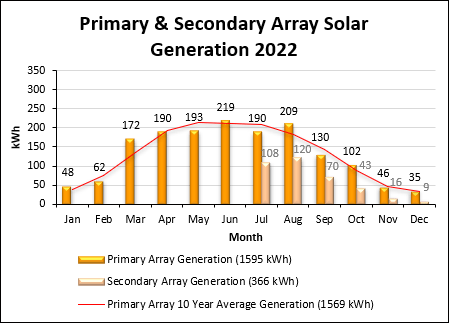
  • 2.8 kWp Solar power generation
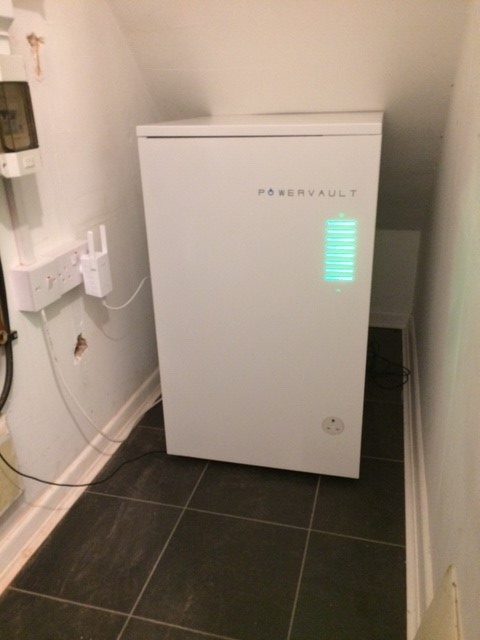
  • Tesla Powerwall 3, 13.5 kWh Electrical energy storage battery (Lithium Iron Phosphate). 
  • Efficient A-rated electrical appliances
  • LED lighting in 100% of outlets
  • 100% green energy supplier Octopus Energy
  • Time-of-use (ToU) electricity tariff (5hrs super cheap off-peak night rate)
  • Electrical energy monitoring system (OpenEnergyMonitor)
  • Renewable power generation from a share in the Ripple Energy Graig Fatha Wind Turbine project.
  • 300 mm Wool Fibre Loft Insulation, Cavity wall insulation, Insulated Front door (no letterbox), Insulated flat roof.
  • Double glazed windows, A-rated, argon-filled, with a low emissivity coating.
  • Plantation Shutters on South-East windows.
  • Main Space & Water Heating –5 kW Mitsubishi Ecodan Air-source Heat Pump.
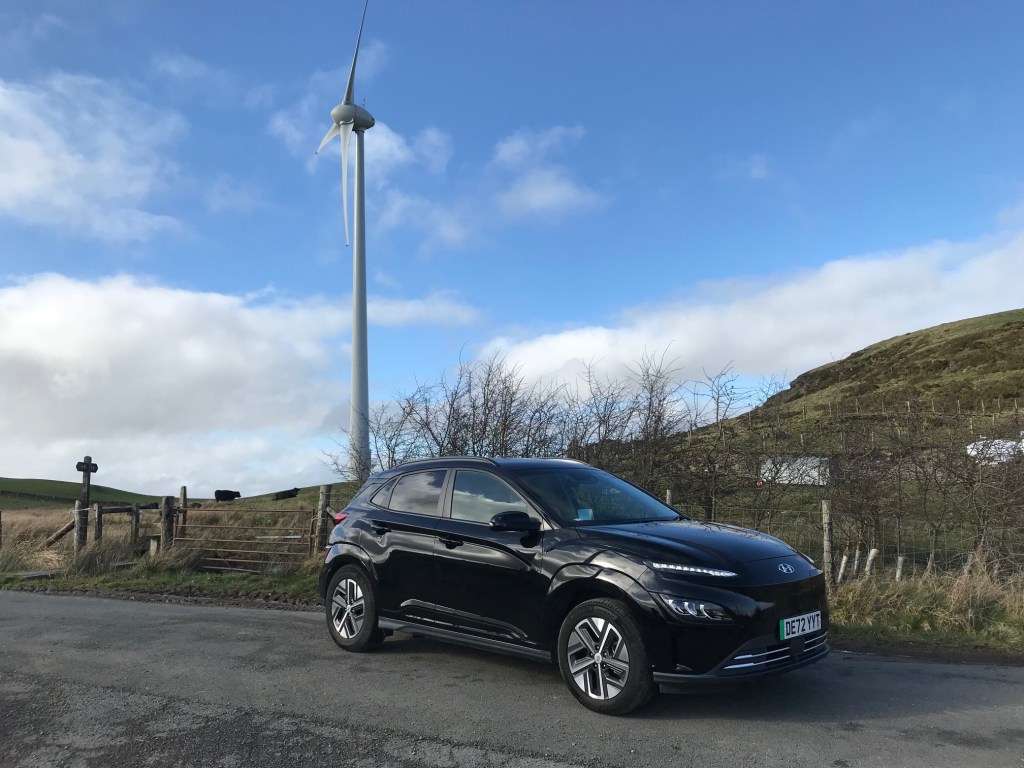
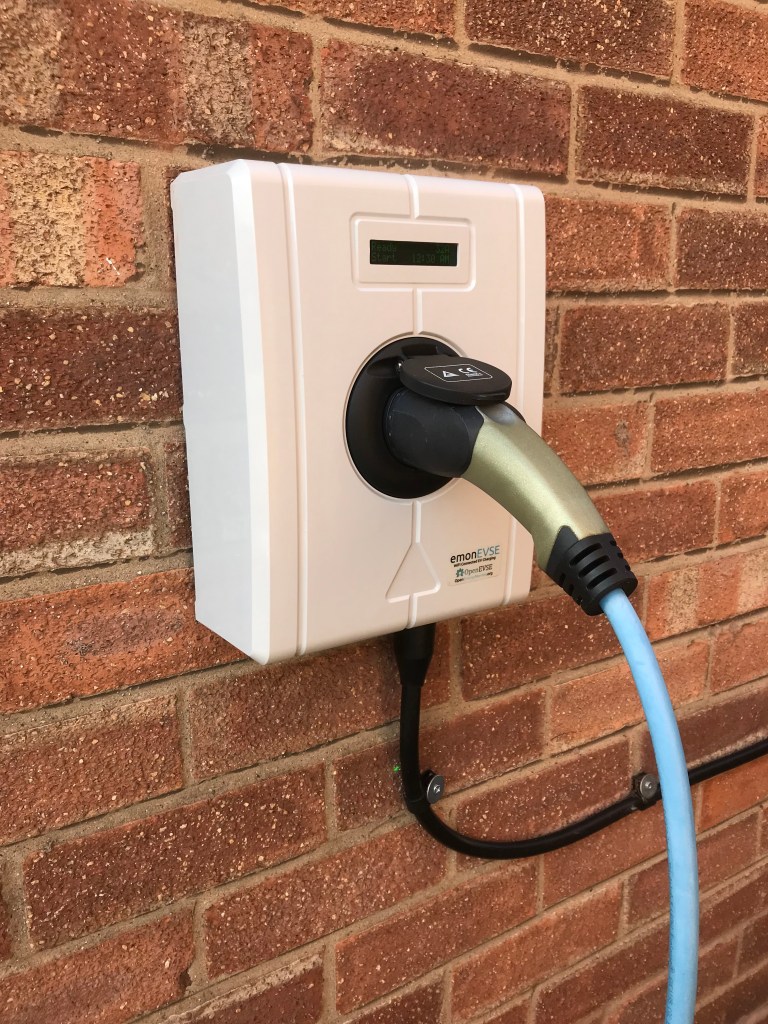
  • Electric Vehicle (350-mile range on one full charge), with smart charging point at the dwelling (can charge on super off-peak rate and solar power).
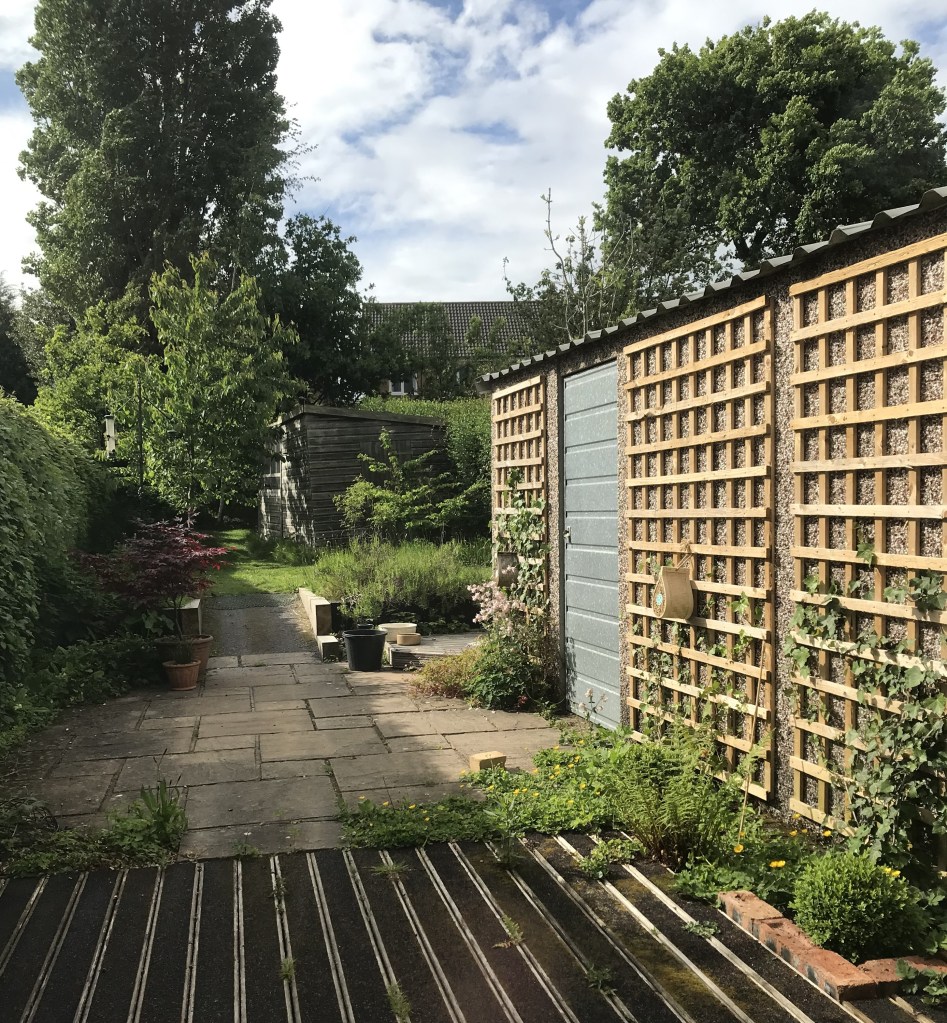
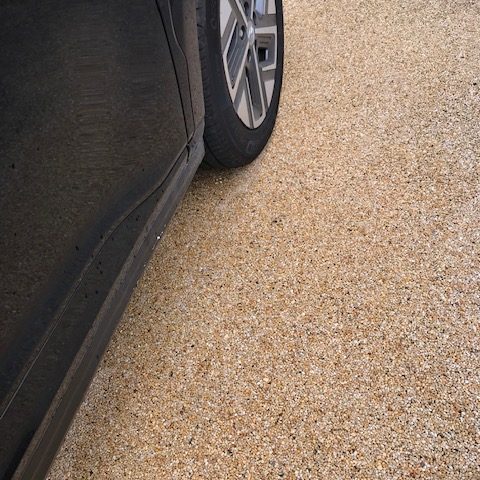
  • Water harvesting and Sustainable drainage system (SuDS) on driveway.
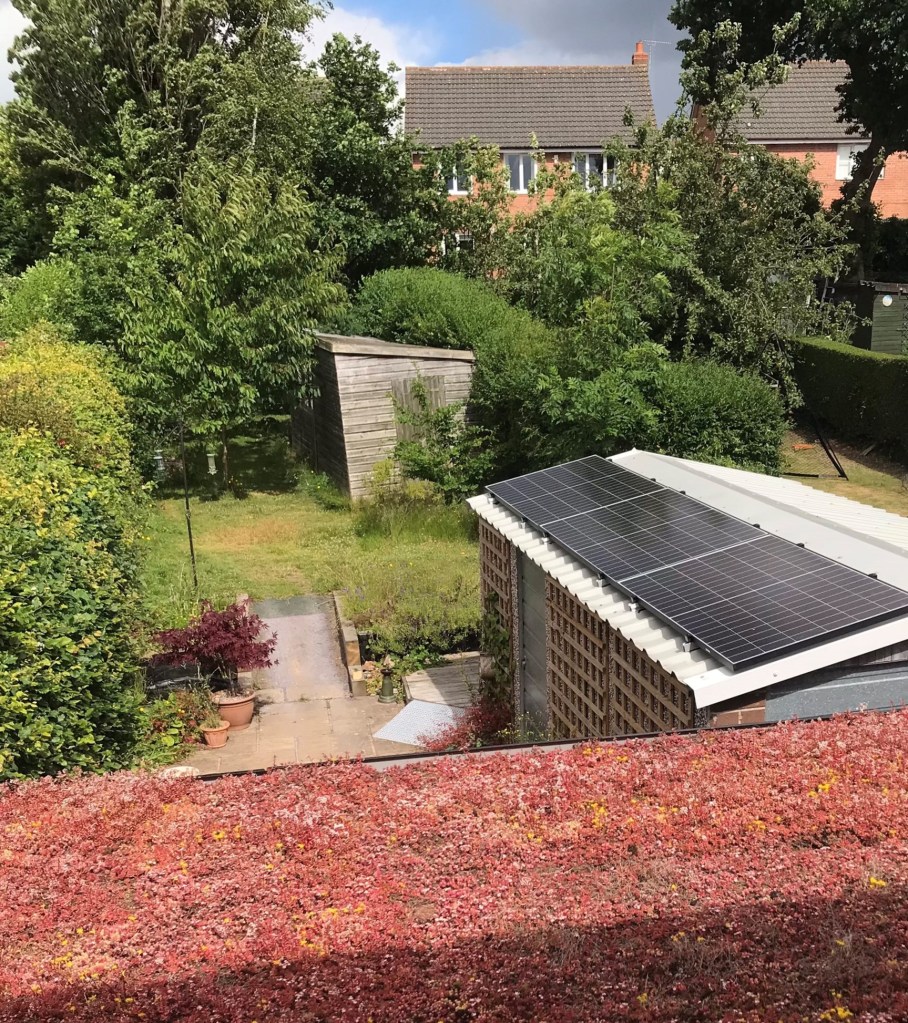
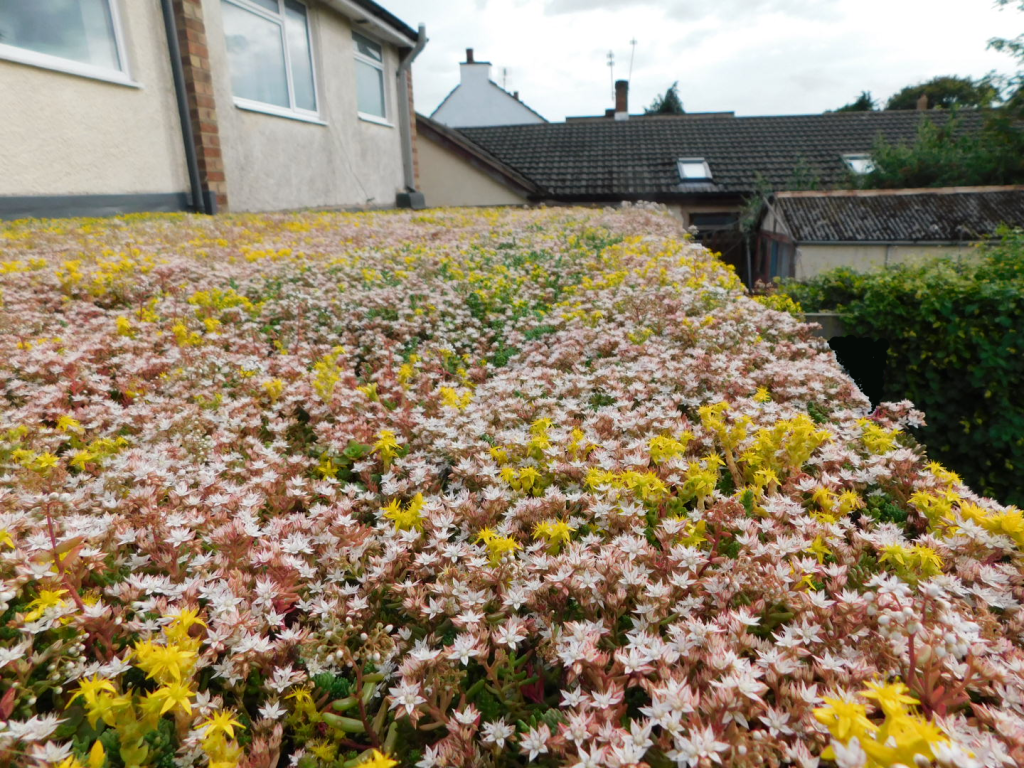
  • Biodiversity enhancement through an annual donation to the Woodland Trust to plant 25 m2 of woodland, 14 native trees planted on-site, two ponds created, a green wall, and an Extensive Sedum Green Roof on flat roof extension.

Supporting Environmental Charities

Green Financing

Referral Codes

Octopus Energy Referral code worth £50,  https://share.octopus.energy/oak-moose-437

Ripple Energy Referral code worth £25, https://rippleenergy.com?ogu=319&rtrfn=Paul-M

In Collaboration with –

The author is a graduate of both The Open University and The Centre for Alternative Technology, and co-founder and a director of The Electric Vehicle Association in Wales EVA Cymru, a non-profit organisation. This Net-zero carbon home is part of the National Energy Foundation SuperHomes Network, and has been used as a case study in course materials for The Open University in 2024.

References

WWF, 2025. Footprint Calculator. Available at: https://footprint.wwf.org.uk/ (Accessed 16 January 2025).

WWF, 2023. Footprint Calculator Report. Available at: https://www.wwf.org.uk/our-reports/footprint-calculator-report-2023 (Accessed 16 January 2025).

The Road to Carbon-Zero 2024  – First Full Year Fossil-Fuel Free & Battery Upgrade

Introduction

This year marked the first full year where no fossil-fuel was used directly to power and heat the dwelling, and fuel car travel. In November, the electrical energy storage battery was replaced and upgraded to a Tesla Powerwall 3 with 13.5 kWh of storage capacity. This will provide stored off-peak electricity and solar generation to power and heat the home throughout the day, even in mid-winter, and will eliminate grid electricity use in mid-summer. Total emissions were again reduced further and personally controllable emissions remained negative at -0.5 tCO2e, importantly in a year when global carbon emissions were recorded to have risen again according to the UK Met Office. The carbon fingerprint is shown in Fig.1. in comparison with previous years and baseline.

Fig.1. The fingerprint of CO2e emissions in 2024, in comparison with previous years and baseline.

Solar Power Generation

The total solar power generation for the year decreased by 228 kWh to 2155 kWh, derived from reading the generation meters. The primary array data shows that solar irradiance was much lower this year than the 12-year average across the entire year. The monthly solar generation data are shown in Fig.2.

Fig.2. Monthly solar generation data.

Wind Power Generation

The total wind power generation from my ownership share in the Graig Fatha turbine for this year was 4766 kWh, displacing this amount of conventional grid electricity generation with carbon intensity of 0.225 kgCO2e/kWh (DECC, 2024) for a 2024 generation mix. This resulted in an emission off-set of 1072 kgCO2e or 1.1 tCO2e. The monthly wind generation data were derived from my personal Ripple dashboard, and are shown in Fig.3.

Fig.3. Monthly wind power generation data.

Household Electricity Consumption

Total annual household electricity grid consumption was reduced on the previous year by 44 kWh or 4% to 1133 kWh, again derived from reading the electricity meter. Consumption was again well below the six-year average, due mainly to the secondary solar array, but also partly to the reduced storage capacity of the battery during the winter months early in the year. The higher storage capacity of the new battery (pictured in Fig.5.) shows increased consumption in the last two months. The higher-than-average consumption in May, August and September corresponds with the very poor solar irradiance in these three months. The monthly grid electricity consumption data are shown in Fig.4.

Fig.4. Monthly household grid electricity consumption data.

The Tesla Powerwall 3 Electrical Energy Storage Battery has a storage capacity of 13.5 kWh and a power delivery of 11 kW, facilitating coverage of any power use in the property without the use of the grid during peak hours. The system can also work seamlessly in isolation from the grid during a power outage using a gateway. The improved battery chemistry of Lithium Iron Phosphate (LFP) is more sustainable in production, has increased longevity, and can work within greater temperature extremes, and is a significant upgrade.

Fig.5. The 13.5 kWh Tesla Powerwall 3 Electrical Energy Storage Battery and gateway.

The assumption was made that only 25% of solar generation was exported, and 75% was consumed on-site, inferred from monitoring system data. Therefore, 1133 kWh grid consumption minus 539 kWh solar export resulted in a net grid electricity consumption of 594 kWh. Grid electricity was given a carbon intensity figure of 0.225 kgCO2e/kWh (DECC, 2024) for a 2024 generation mix. The combined solar self-consumption and exported generation resulted in emissions remaining stable at 134 kgCO2e or 0.1 tCO2e.

Space and Water Heating

Space heating and water heating was provided by the Mitsubishi Ecodan 5 kW Air-source heat pump (ASHP) for the first full year. The ASHP consumed a total of 2464 kWh of electricity, with 2118 kWh from the grid and the difference supplied by solar power, derived from both a meter and the heating controller, and was given a carbon intensity figure of 0.225 kgCO2e/kWh (DECC, 2024) for a 2024 generation mix. This resulted in 477 kgCO2e or 0.5 tCO2e emissions, approximately half the annual emissions of the gas combi boiler whilst providing more than double the heat and more constant thermal comfort. Importantly, the electrical consumption produced 11056 kWh of heat, giving a coefficient of performance (COP) of 4.01. Essentially, every unit of electrical input delivers 4 units of heat, an efficiency of 400%. For context, a new gas boiler has a real-world efficiency of around 90%, which would only deliver 4675 kWh of heat based on the 10-year average gas consumption in this case. The monthly consumption data is shown in comparison with gas in Fig.6.

Fig.6. Monthly Space & water heating electricity consumption data.

Car Travel

The car in use was a battery electric vehicle (BEV) Hyundai Kona 64-kWh. The annual mileage estimated to the nearest 1000 increased to 13000 miles, or 20500 km. The car was charged in part directly from the solar arrays, and 184 kWh was delivered this way equating to approximately 1200 km. This meant grid consumption was reduced, providing 19300 km of travel. As the fuel is electricity, the carbon intensity figure of fuel production and use in an electric vehicle is the same as is given for grid electricity, which this year was 0.225 kgCO2e/kWh (DECC, 2024) for a 2024 generation mix. The car consumed 2880 kWh of electricity to charge, derived from monthly readings of the night time consumption meter and shown as a column chart in Fig.7., resulting in fuel production emissions only increasing to 615 kgCO2e or 0.6 tCO2e.

Note: In the units previously given for vehicle emissions, 2024 grid electricity equates to 0.03 kgCO2e/km.

Fig.7. Monthly car charging data. (Note: 9-year average excludes 2020 due to pandemic lock-down anomaly).

Water Consumption

Total annual household water consumption increased to 19 m3, derived from a utility bill for that year. The 2024 carbon intensity figure of domestic water supply (0.153 kgCO2e/m3), and treatment (0.186 kgCO2e/m3) is given as 0.339 kgCO2e/m3 (DECC, 2024). This resulted in a 50% increase of 2 kgCO2e to 6 kgCO2e or 0.01 tCO2e emissions. The reason for this increased consumption is not known, and therefore could highlight a potential underground leak or meter issue which is under investigation.

Lifestyle

There were no changes regarding lifestyle in this year, so there was no effect to the results for lifestyle in the carbon footprint calculator (WWF, 2024), and emissions remained at 0.5 tCO2.

Infrastructure

The figure for infrastructure emissions from the carbon footprint calculator remained at 2.75 tCO2 for each UK citizen. The annual donation to the Woodland Trust to plant 25 m2 of woodland, the 14 trees planted, and the green roof and wall off-set and sequester -1.15 tCO2 of these indirect emissions.

Behaviours

There were no behavioural changes in this year, but all previous behavioural changes were maintained. However, the increased storage capacity and power output of the new battery will facilitate more flexibility in electrical power use, for example being able to run several high output appliances at the same time without grid input, if circumstances require it. Previously, this was avoided unless absolutely necessary.

Conclusions

Overall, emissions decreased compared to the previous year by 12% or 0.3 tCO2e, resulting in 79% or 8.5 tCO2e lower annual emissions compared to the baseline year. The ASHP accounted for the decrease, replacing gas for space and water heating, on average halving emissions from this sector. Wind power generation off-set 92% of electricity grid consumption for the home, travel, and space and water heating. This is a great result, considering the share in the wind turbine was matched to provide the consumption of the home and car, but is now also providing most of the heating consumption to.

References

The Department for Energy and Climate Change (2024). Greenhouse gas reporting – Conversion factors 2024. Available at: https://www.gov.uk/government/publications/greenhouse-gas-reporting-conversion-factors-2024 (Accessed 14 January 2025).

WWF, 2025. Footprint Calculator. Available at: https://footprint.wwf.org.uk/ (Accessed 16 January 2025).

The Road to Carbon-Zero 2023  – Electrification of Everything

Introduction

In October this year, an Air-source heat pump was installed, electrifying the space and water heating of the dwelling, and completing the electrification of everything. On November 3rd the gas meter was removed and the supply disconnected. From this moment, the dwelling and travel were 100% fossil-fuel free; net-zero carbon emissions; and net-zero energy bills. In terms of personally controllable emissions, by omitting infrastructure emissions, the value was carbon negative by 0.25 tCO2e. A landmark moment for an average UK dwelling, car mileage, and modern lifestyle. The carbon fingerprint is shown in Fig.1. in comparison with previous years and baseline.

Fig.1. The fingerprint of CO2e emissions in 2023, in comparison with previous years and baseline.

Solar Power Generation

The total solar power generation for the year increased by 422 kWh to 2383 kWh, mainly due to the first full year’s generation from the secondary array, derived from reading the generation meters. The primary array data shows that solar irradiance was lower this year than the 10-year average. The monthly solar generation data are shown in Fig.2.

Fig.2. Monthly solar generation data.

Wind Power Generation

The total wind power generation from my ownership share in the Graig Fatha turbine for this first full year was 4926 kWh, displacing this amount of conventional grid electricity generation with carbon intensity of 0.225 kgCO2e/kWh (DECC, 2023) for a 2023 generation mix. This resulted in an emission off-set of 1108 kgCO2e or 1.1 tCO2e. The monthly wind generation data were derived from my personal Ripple dashboard, and are shown in Fig.3.

Consumer-owned Energy Provider Ripple Energy Referral code worth £25: https://rippleenergy.com?ogu=319&rtrfn=Paul-M

Fig.3. Monthly wind power generation data.

Household Electricity Consumption

Total annual household electricity grid consumption was reduced on the previous year by 23 kWh or 2% to 1177 kWh, again derived from reading the electricity meter. Consumption this year was well below the five-year average, again mainly due to the secondary solar array. The monthly grid electricity consumption data are shown in Fig.4.

Fig.4. Monthly grid electricity consumption data.

The assumption was made that only 25% of solar generation was exported, and 75% was consumed on-site. Therefore, 1177 kWh grid consumption minus 596 kWh solar export resulted in a net grid electricity consumption of 581 kWh. Grid electricity was given a carbon intensity figure of 0.225 kgCO2e/kWh (DECC, 2023) for a 2023 generation mix. The combined solar self-consumption and exported generation resulted in an emission decrease of 19 kgCO2e to 131 kgCO2e or 0.1 tCO2e.

Green Energy Supplier Octopus Energy Referral code worth £50: https://share.octopus.energy/oak-moose-437

Space and Water Heating

Space heating and minimal water heating was provided by the gas grid between January and October. Total annual household gas consumption decreased by 29% on the previous year to 3479 kWh, derived from monthly meter readings, shown as a column chart in Fig.5., and given a carbon intensity figure of 0.2 kgCO2e/kWh (DECC, 2023). This resulted in a decrease of 289kgCO2e to 696 kgCO2e or 0.7 tCO2e emissions.

In the last week of October, the Mitsubishi Ecodan 5 kW Air-source heat pump (ASHP), pictured in Fig.6., was commissioned and began providing all space and water heating electrically for the remainder of the year. The ASHP is assumed to consume all the solar generation which is not exported through the winter months, but is supplied mostly by the electricity grid directly, and indirectly by the battery during peak hours. The ASHP consumed 664 kWh of grid electricity, derived from both a meter and the heating controller, and was given a carbon intensity figure of 0.225 kgCO2e/kWh (DECC, 2023) for a 2023 generation mix. This resulted in 149 kgCO2e or 0.1 tCO2e emissions. The consumption is shown in comparison with gas in Fig.5.

Fig.5. Monthly Space & water heating energy consumption data.

The chart shows how much more efficient the ASHP is, using considerably less energy to provide more heat to the space and water. The house was considerably warmer and more comfortable constantly after the installation. The combination of solar generation, battery storage, and cheap over-night electricity tariff meant the cost was less than gas heating, and these costs were offset by the revenue from the wind turbine and solar Feed-in-Tariff. Net-zero carbon, net-zero cost heating!

Fig.6. The Mitsubishi Ecodan 5 kW Air-source heat pump, located on the side of the property.

Car Travel

The car in use was a battery electric vehicle (BEV). At the end of 2022, the BMW i3 was changed for a Hyundai Kona, pictured in Fig.8. This car is similar in size to the original 100-mile range 24 kWh battery Nissan Leaf, but has a 64 kWh battery providing up to 350 miles of range on a full charge, demonstrating the improvements in battery chemistry and energy density since 2014. The annual mileage estimated to the nearest 1000 remained at 12000 miles, or 19000 km. However, this year the car was able to be charged directly from the solar arrays, and 224 kWh was delivered this way equating to approximately 1500 km. This meant grid consumption was reduced, providing 17,500 km of travel. As the fuel is electricity, the carbon intensity figure of fuel production and use in an electric vehicle is the same as is given for grid electricity, which this year was 0.225 kgCO2e/kWh (DECC, 2023) for a 2023 generation mix. The car consumed 2309 kWh of electricity to charge, derived from monthly readings of the night time consumption meter and shown as a column chart in Fig.6., resulting in fuel production emissions only remaining at 520 kgCO2e or 0.5 tCO2e.

Note: In the units previously given for vehicle emissions, 2023 grid electricity equates to 0.030 kgCO2e/km.

Fig.7. Monthly car charging data. (Note: 8-year average excludes 2020 due to pandemic lock-down anomaly).

Fig.8. The 64 kWh Battery Electric Hyundai Kona.  

Water Consumption

Total annual household water consumption was reduced to 10 m3, derived from a utility bill for that year. The 2022 carbon intensity figure of domestic water supply (0.149 kgCO2e/m3), and treatment (0.272 kgCO2e/m3) is given as 0.421 kgCO2e/m3 (DECC, 2023). This resulted in a 20% reduction of 1 kgCO2e to 4 kgCO2e or 0.0 tCO2e emissions.

Lifestyle

There were no changes regarding lifestyle in this year, so there was no effect to the results for lifestyle in the carbon footprint calculator (WWF, 2023), and emissions remained at 0.5 tCO2.

Infrastructure

The figure for infrastructure emissions in the carbon footprint calculator (WWF, 2023) remained at 2.75 tCO2 for each UK citizen. The annual donation to the Woodland Trust to plant 25 m2 of woodland, the 14 trees planted, and the green roof and wall off-set and sequester -1.15 tCO2 of these indirect emissions.

Behaviours

The addition of the Air-source heat pump required some adjustment to the use of the electrical energy storage (EES) battery. During the winter months, the battery was now charged every night at off-peak rate to discharge and power the heat pump during peak-time periods during the day and evening. It should also be noted that the lead-acid battery after five years of use had, expectedly, reduced in storage capacity by 0.5 kWh. Increased electricity consumption from the heat pump, and reducing battery storage capacity would require a battery upgrade in the next year.

Conclusions

Overall, emissions decreased compared to the previous year by 19% or 0.6 tCO2e, resulting in 77% or 8.2 tCO2e lower emissions compared to the baseline year. A reduction in gas consumption through replacement in the last quarter of the year with the ASHP accounted for 0.3 tCO2e of the decrease. For the second successive year, wind power generation completely off-set all electricity grid consumption for both the home and travel, and this year that included the power consumption of the heat pump for space and water heating, also providing an excess and the remaining 0.3tCO2e reduction through displacing emissions from the National Grid.

References

The Department for Energy and Climate Change (2023). Greenhouse gas reporting – Conversion factors 2023. Available at: Greenhouse gas reporting: conversion factors 2022 – GOV.UK (www.gov.uk) (accessed 17th December 2023).

WWF-UK (2023). Available at: WWF Footprint Calculator (accessed January 2023).

The Road to Carbon-Zero 2022 – Net-zero for Electricity use

Overview

In March, the Ripple Energy Graig Fatha Wind Turbine project, the UK’s first consumer-owned renewable energy generation source, came on-line and began generating zero-carbon electricity. In addition, in July a new 1 kWp secondary solar array was installed on the south-west facing roof of the garage, and the car charging point on the side of the house was replaced with a ‘smarter’ device which enables the car to charge directly from solar generation with no grid input. These measures resulted in net-zero emissions for total electricity use for the first time. The carbon fingerprint is shown in Fig.1. in comparison with previous years and baseline.

Fig.1. The fingerprint of CO2e emissions in 2022, in comparison with previous years and baseline.

Solar Power Generation

The total solar power generation for the year increased by 449 kWh to 1961 kWh, mainly due to the new 1 kW secondary array shown in Fig.3., but also higher solar irradiance. Data were derived from reading the generation meters. The monthly solar generation data are shown in Fig.2.

Fig.2. Monthly solar generation data.

Fig.3. The secondary 1 kWp solar array on the south-west facing garage roof. Maturing planted trees and green roof are also in view.

Wind Power Generation

The total wind power generation from my ownership share in the Graig Fatha turbine (Fig.5.), for this part-year was 3195 kWh, displacing this amount of conventional grid electricity generation with carbon intensity of 0.211 kgCO2e/kWh (DECC, 2022) for a 2022 generation mix. This resulted in an emission off-set of 674 kgCO2e or 0.7 tCO2e. The monthly wind generation data were derived from my personal Ripple dashboard, and are shown in Fig.4.

Fig.4. Monthly wind power generation data.

Fig.5. Graig Fatha, consumer-owned 2 Mega-Watt wind turbine. (Photo source: Ripple Energy)

Household Electricity Consumption

Total annual household electricity grid consumption was reduced on the previous year by 36 kWh or 3% to 1200 kWh, again derived from reading the electricity meter. The monthly grid electricity consumption data are shown in Fig.6.

Fig.6. Monthly grid electricity consumption data.

The assumption was made that only 25% of solar generation was exported, and 75% was consumed on-site. Therefore, 1200 kWh grid consumption minus 490 kWh solar export resulted in a net grid electricity consumption of 710 kWh. Grid electricity was given a carbon intensity figure of 0.211 kgCO2e/kWh (DECC, 2022) for a 2022 generation mix. The combined solar self-consumption and exported generation resulted in an emission decrease of 48 kgCO2e to 150 kgCO2e or 0.2 tCO2e.

Space and Water Heating

Total annual household gas consumption decreased by 3% on the previous year to 4926 kWh, derived from monthly meter readings, shown as a column chart in Fig.7. All consumption was provided by the gas grid, and given a carbon intensity figure of 0.2 kgCO2e/kWh (DECC, 2022). This resulted in a decrease of 45kgCO2e to 985 kgCO2e, stabilising emissions at 1.0 tCO2e.

Fig.7. Monthly gas consumption data.

Car Travel

The car in use was a battery electric vehicle (BEV). The annual mileage estimated to the nearest 1000 decreased on the previous year to 12000 miles, or 19000 km. As the fuel is electricity, the carbon intensity figure of fuel production and use in an electric vehicle is the same as is given for grid electricity, which this year was 0.211 kgCO2e/kWh (DECC, 2022) for a 2022 generation mix. The car consumed 2464 kWh of electricity to charge, derived from monthly readings of the night time consumption meter and shown as a column chart in Fig.8., resulting in a decrease in fuel production emissions only to 520 kgCO2e or 0.5 tCO2e.

Note: In the units previously given for vehicle emissions, 2022 grid electricity equates to 0.027 kgCO2e/km.

The new charging device, shown in Fig.9., was supplied by the same company that produce the energy monitoring system, OpenEnergyMonitor, therefore enabling the two devices to talk to each other, and allowing charging to start and stop with changes in solar generation.

Fig.8. Monthly car charging data. (Note: 7-year average excludes 2020 due to pandemic lock-down anomaly).

Fig.9. The smart car charging point by OpenEnergyMonitor on the side of the house.

Water Consumption

Total annual household water consumption was reduced to 10 m3, derived from a utility bill for that year. The 2022 carbon intensity figure of domestic water supply (0.149 kgCO2e/m3), and treatment (0.272 kgCO2e/m3) is given as 0.421 kgCO2e/m3 (DECC, 2022). This resulted in a 20% reduction of 1 kgCO2e to 4 kgCO2e or 0.0 tCO2e emissions.

Adapting to Climate Change Update

On 18 July, a new provisional national temperature record for Wales of 37.1°C was recorded at Hawarden Airport, Flintshire, just three miles from my home. At 2pm the sun was overhead, beaming down on the green roof, and the outside shade temperature peaked at 36.1 oC. The air temperature beneath the green roof was 11 oC cooler than the outside shade, and the inside temperature remained bearable and peaked at 24.9 oC. Furthermore, a bare rubber flat roof in full sun would be more like 60 oC rather than the 36 oC shade temperature.

There is no doubt that the combined measures of loft and cavity wall insulation, A-rated double glazing, green roof, and shutters kept the inside space comfortable in the face of extreme heat. Importantly, no extra energy was used or needed to cool the internal space.

Lifestyle

There were no changes regarding lifestyle in this year, so there was no effect to the results for lifestyle in the carbon footprint calculator (WWF, 2022), and emissions remained at 0.5 tCO2.

Infrastructure

The figure for infrastructure emissions in the carbon footprint calculator (WWF, 2016) remained at 2.75 tCO2 for each UK citizen. The annual donation to the Woodland Trust to plant 25 m2 of woodland, the 14 trees planted, and the green roof and wall off-set and sequester -1.15 tCO2 of these indirect emissions.

Behaviours

The addition of wind generation, second solar array, and smart car charging allowed further behavioural change around electricity use, maximising zero-carbon sources. The additional solar array would enable the car to be charged during the day using peak solar generation in the summer months in the following year. The wind power generation allowed overnight car and house battery charging when the turbine was generating, and a four-day ahead forecast enabled the amount of charging to be increased or decreased accordingly.

Conclusions

Overall, emissions decreased compared to the previous year by 23% or 0.9 tCO2e, resulting in 71% or 7.6 tCO2e lower emissions compared to the baseline year. A reduction in travel mileage accounted for 0.2 tCO2eof the decrease, however the remaining 0.7tCO2e came from wind power generation. In fact, this completely off-set all electricity grid consumption for both the home and travel, and emissions from water consumption were also eliminated, both for the first time in this year.

References

The Department for Energy and Climate Change (2022). Greenhouse gas reporting – Conversion factors 2022. Available at: Greenhouse gas reporting: conversion factors 2022 – GOV.UK (www.gov.uk) (accessed 17th December 2023).

WWF-UK (2021). Available at: WWF Footprint Calculator (accessed January 2023).

The Road to Carbon-Zero 2021 – Adapting to Climate Change & Enhancing Biodiversity

Overview

In this year, measures were taken to adapt to the already noticeable and future impacts of Climate Change. A green wall and green roof were planted to reduce heat absorption of the building and cool the air around the building, whilst also absorbing atmospheric carbon and rainfall and enhancing biodiversity. On the South-East facing windows, plantation shutters were installed, to reduce heat gain in summer and heat loss in winter of the building interior. The carbon fingerprint is shown in Fig.1. in comparison with previous years and baseline.

Fig.1. The fingerprint of CO2e emissions in 2021, in comparison with previous years and baseline.

Solar Power Generation

The total solar power generation for the year decreased slightly by 47 kWh to 1512 kWh, derived from reading the generation meter. The monthly solar generation data are shown in Fig.2. Annual generation was lower than the nine-year average, but monthly generation showed a typical pattern apart from a high reading for April.

Fig.2. Monthly solar generation data.

Household Electricity Consumption

Total annual household electricity grid consumption was reduced on the previous year by 260 kWh or 17% to 1236 kWh, again derived from reading the electricity meter. The monthly grid electricity consumption data are shown in Fig.3.

Fig.3. Monthly grid electricity consumption data.

The assumption was made that only 25% of solar generation was exported, and 75% was consumed on-site. Therefore, 1236 kWh grid consumption minus 378 kWh solar export resulted in a net grid electricity consumption of 858 kWh. Grid electricity was given a carbon intensity figure of 0.231 kgCO2e/kWh (DECC, 2021) for a 2021 generation mix. The combined solar self-consumption and exported generation resulted in an emission decrease of 81 kgCO2e to 198 kgCO2e or 0.2 tCO2e.

In July, the Octopus Agile electricity tariff was changed to another ToU tariff Octopus Go, an EV tariff which gives four hours of super cheap electricity to charge the EV and house battery at night, bringing further cost reduction.

Space and Water Heating

Total annual household gas consumption decreased by 8% on the previous year to 5074 kWh, derived from monthly meter readings, shown as a column chart in Fig.4. All consumption was provided by the gas grid, and given a carbon intensity figure of 0.203 kgCO2e/kWh (DECC, 2021). This resulted in a decrease of 95kgCO2e to 1030 kgCO2e or 1.0 tCO2e emissions.

Fig.4. Monthly gas consumption data.

Car Travel

The car in use was a battery electric vehicle (BEV). The annual mileage estimated to the nearest 1000 increased considerably on the previous year back to 14000 miles, or 22000 km. As the fuel is electricity, the carbon intensity figure of fuel production and use in an electric vehicle is the same as is given for grid electricity, which this year was 0.231 kgCO2e/kWh (DECC, 2021) for a 2021 generation mix. The car consumed 3051 kWh of electricity to charge, derived from monthly readings of the night time consumption meter and shown as a column chart in Fig.5., resulting in an increase in fuel production emissions only to 705 kgCO2e or 0.7 tCO2e.

Note: In the units previously given for vehicle emissions, 2021 grid electricity equates to 0.032 kgCO2e/km.

Fig.5. Monthly car charging data. (Note: 6-year average excludes 2020 due to pandemic lock-down anomaly).

Water Consumption

Total annual household water consumption remained at 11 m3, derived from a utility bill for that year. However, the 2021 carbon intensity figure of domestic water supply (0.149 kgCO2e/m3), and treatment (0.272 kgCO2e/m3) given as 0.421 kgCO2e/m3 (DECC, 2021), was reduced by 60% on the previous year. This resulted in an equivalent reduction in emissions of 7 kgCO2e to 5 kgCO2e, but rounding meant emissions remained at 0.01 tCO2e in the footprint.

Adapting to Climate Change & Enhancing Biodiversity

A green wall was planted to cover the walls of the stand-alone garage (Fig.6.). This consisted of native ivy shrubs which, when fully grown, will cover 8m2 of concrete wall. Some low growing shrubs were also planted consisting of box and heat tolerant Mediterranean herbs. This should prevent the South-facing concrete walls of the garage absorbing and storing heat, cooling the space, and will provide a new feeding resource and habitat for many invertebrates and birds.

Fig.6. The freshly planted green wall.

A small wildlife pond (Fig.7.) was also created to provide new habitat for aquatic species, particularly frogs and newts. This also reflects sunlight and further cools the space through evaporation in summer, and provides an additional water store throughout the year.

Fig.7. The wildlife pond with flag iris in flower.

To cover an 18m2 area flat-roof extension at the rear of the property, a light-weight extensive sedum green-roof system was installed (Fig.8.). Green roofs provide multiple benefits, such as protecting the external roof layer from UV light and weather damage, prolonging the life of the roof; reducing rain-water run-off rate during heavy rainfall; cooling the air, reducing the urban heat island effect; insulating the roof, reducing internal heat loss in winter and heat gain in summer; enhancing biodiversity through providing an important food resource for pollinators such as native bumble and solitary bees and butterflies during the summer months; and absorbing carbon dioxide from the atmosphere. They are also aesthetically very pleasing, particularly in summer.

Fig.8. The light-weight extensive sedum green-roof system in full bloom in summer.

Plantation shutters (Fig.9.), in a highly reflective white, were fitted on the front SE facing windows. These were intended to have the double benefit of keeping in heat in winter and heat out in summer. They can also be opened right out to allow passive thermal solar gain during the heating season. Primarily these will have most benefit in winter and some benefit in summer, but with future predictions of higher summer temperatures, the summer benefit should increase.

Fig.9. The plantation shutters, in a highly reflective white, on the front SE facing windows.

Lifestyle & Behaviours

There were no changes regarding lifestyle and behaviours in this year, so there was no effect to the results for lifestyle in the carbon footprint calculator (WWF, 2021), and emissions remained at 0.5 tCO2.

Infrastructure

The figure for infrastructure emissions in the carbon footprint calculator (WWF, 2021) remained at 2.75 tCO2 for each UK citizen. The annual donation to the Woodland Trust to plant 25 m2 of woodland, and the 14 trees planted to off-set and sequester these indirect emissions were joined by a small contribution from the green roof and wall, estimated to be 10 kg per year, resulting in a total value of -1.15 tCO2/year.

Conclusions

Overall, emissions remained stable compared to the previous year, and 63% or 6.7 tCO2e lower compared to the baseline year. Small decreases in emissions for gas consumption and net household electricity use, and further sequestration from added vegetation, were cancelled out by an increase in emissions for car travel as normal mileage resumed compared to the pandemic lock-down restrictions of the previous year. In addition, below average solar generation was countered by a reduction in electricity use.

References

The Department for Energy and Climate Change (2021). Greenhouse gas reporting – Conversion factors 2021. Available at: Greenhouse gas reporting: conversion factors 2021 – GOV.UK (www.gov.uk) (accessed 16th December 2023).

WWF-UK (2021). Available at: WWF Footprint Calculator (accessed January 2022).

The Road to Carbon-Zero 2020 – EV Upgrade, Energy Monitoring, and Covid Impact.

Overview

At the end of 2019, the Nissan Leaf was replaced with another battery electric vehicle (BEV), the BMWi3. This BEV had a 42-kWh battery and was lighter and more efficient, which increased the driving range from 90 miles to 240 miles on a single full charge. At the beginning of the year, an energy monitoring system from OpenEnergyMonitor was installed to see the electricity consumption and solar generation in real time to optimise efficiency and further reduce energy cost, grid electricity consumption, and carbon emissions. The Covid-19 pandemic ‘lock-downs’ also had some impact on consumption patterns. The carbon fingerprint is shown in Fig.1. in comparison with previous years and baseline.

Fig.1. The fingerprint of CO2e emissions in 2020, in comparison with previous years and baseline.

Solar Power Generation

The total solar power generation for the year decreased slightly by just 4 kWh to 1559 kWh, derived from reading the generation meter. The monthly solar generation data are shown in Fig.2. Whilst annual generation remained close to the eight-year average, monthly generation showed some unusual variation.

Fig.2. Monthly solar generation data.

Household Electricity Consumption

Total annual household electricity grid consumption increased on the previous year by 122 kWh or 9% to 1496 kWh, again derived from reading the electricity meter. This increase was mainly due to the replacement of the combi-boiler fed shower with an electric version. The monthly grid electricity consumption data are shown in Fig.3., in comparison to the previous year’s consumption, being the first complete data set with the battery system. This highlights the increased grid consumption in June and July due to cloudy conditions reducing solar generation.

Fig.3. Monthly grid electricity consumption data.

The assumption was made that only 25% of solar generation was exported, and 75% was consumed on-site. Therefore, 1496 kWh grid consumption minus 390 kWh solar export resulted in a net grid electricity consumption of 1106 kWh. Grid electricity was given a carbon intensity figure of 0.253 kgCO2e/kWh (DECC, 2020) for a 2020 generation mix. The combined solar self-consumption and exported generation resulted in an emission increase of 6 kgCO2e to 279 kgCO2e or 0.28 tCO2e.

The figures below show screenshots of two types of electrical energy data monitoring. Fig.4. shows the electricity consumption pattern for one day using Octopus agile ToU tariff. The pink line shows the 30-minute wholesale electricity price, blue bars are grid consumption, yellow bars are solar generation exported, and green bars are solar generation consumed on-site. In this view, the house battery was charged at night and the EV was charged in the afternoon, both to absorb surplus grid power when the electricity price was negative, i.e. getting paid to charge batteries.

Fig.4. Energy Monitoring ‘Octopus Agile’ App view on 23/05/2020.

The solar generation (Yellow) and electrical consumption (Blue) are shown for the same day using the ‘MY Solar’ App in Fig.5. (note the slightly longer timescale on this view). The full screen view shows real-time values for solar generation, export, and consumption (not shown here). What this day shows is that grid import was high as there was monetary incentive to do so, and solar export was also high as the battery was charged overnight.

Fig.5. Energy Monitoring ‘My Solar’ App view on 23/05/2020.

Space Heating

Total annual household gas consumption decreased by 8% on the previous year to 5513 kWh, derived from monthly meter readings, shown as a column chart in Fig.6. All consumption was provided by the gas grid, and given a carbon intensity figure of 0.204 kgCO2e/kWh (DECC, 2020). This resulted in a decrease of 101kgCO2e to 1125 kgCO2e or 1.1 tCO2e emissions. The decrease was due to water heating now being supplied by electricity.

Fig.6. Monthly gas consumption data.

Car Travel

The car in use was a BMWi3 battery electric vehicle (BEV). The annual mileage estimated to the nearest 1000 reduced considerably to 9000 miles, or 15000 km, a consequence of the Covid-19 pandemic travel limitations. As the fuel is electricity, the carbon intensity figure of fuel production and use in an electric vehicle is the same as is given for grid electricity, which this year was 0.253 kgCO2e/kWh (DECC, 2020) for a 2020 generation mix. The car consumed 2014 kWh of electricity to charge, derived from monthly readings of the night time consumption meter and shown as a column chart in Fig.7., which highlights the travel reduction particularly during March-May, resulting in a reduction in fuel production emissions only to 510 kgCO2e or 0.5 tCO2e.

Note: In the units previously given for vehicle emissions, 2020 grid electricity equates to 0.034 kgCO2e/km.

Fig.7. Monthly car charging data.

Water Consumption

Total annual household water consumption was reduced to 11 m3, derived from a utility bill for that year. The 2020 carbon intensity figure of domestic water supply (0.344 kgCO2e/m3), and treatment (0.708 kgCO2e/m3) is given as 1.052 kgCO2e/m3 (DECC, 2020). This resulted in a 40% reduction of 8 kgCO2e to 12 kgCO2e or 0.01 tCO2e emissions.

Lifestyle

In July, an investment was made in Ripple Energy Graig Fatha Wind Turbine project, the UK’s first consumer-owned renewable energy generation source, primarily to get renewable sources built, but with the addition of providing a zero-carbon source of electricity to power the electric car during winter when solar power is minimal, and revenue which will eliminate the electricity bill. This did not affect the results for lifestyle in the carbon footprint calculator (WWF, 2020), so emissions remained at 0.5 tCO2.

Infrastructure

The figure for infrastructure emissions in the carbon footprint calculator (WWF, 2020) remained at 2.75 tCO2 for each UK citizen. The annual donation to the Woodland Trust to plant 25 m2 of woodland, and the 14 trees planted off-set and sequester -1.14 tCO2 of these indirect emissions.

Behaviours

There was a forced behavioural change in this year for health reasons. The bathroom had to be re-modelled to a wet-room for wheelchair access. This meant removal of the bath, and installation of an electric thermostatic shower. The energy implication of this resulted in reducing gas consumption by using battery, solar and grid electricity to heat water for showering, and water consumption was reduced by only taking showers.

Conclusions

Overall, emissions decreased compared to the previous year by 9% or 0.4 tCO2e, resulting in 63% or 6.7 tCO2e lower compared to the baseline year. The decrease was due mostly to reduced travel from the Covid-19 pandemic lock-down travel limitations. There was a further slight decrease in gas consumption for space heating. The reduction would have been greater but was limited by below average solar generation. There was also a significant reduction in water use, due to the removal of the bath.

References

The Department for Energy and Climate Change (2020). Greenhouse gas reporting – Conversion factors 2020. Available at: Greenhouse gas reporting: conversion factors 2020 – GOV.UK (www.gov.uk) (accessed 14th December 2023).

WWF-UK (2020). Available at: WWF Footprint Calculator (accessed January 2021).

The Road to Carbon-Zero 2019 – A Low-Carbon Grid & Time-of-Use Tariffs

Overview

The first full year with battery storage, and the low-carbon intensity of the grid begins to make electrifying everything viable, combining EV’s, battery storage, and time-of-use (ToU) tariffs. Innovative energy company Octopus introduce several of these ToU tariffs, and switching onto their Agile tariff, which follows the wholesale price of electricity every half hour using the smart meter, enabled being paid to store electricity in the EV and house battery when there is surplus supply on the grid system, usually at night and from wind power sources. In addition, during the evening peak the battery can then be discharged to prevent paying the highest cost to import power. The carbon fingerprint is shown in Fig.1. in comparison with previous years and baseline.

Fig.1. The fingerprint of CO2e emissions in 2019, in comparison with previous years and baseline.

Solar Power Generation

The total solar power generation for the year decreased on the previous year by 49 kWh, back close to the seven-year annual average, to 1563 kWh, derived from reading the generation meter. The monthly solar generation data are shown in Fig.2.

Fig.2. Monthly solar generation data.

Household Electricity Consumption

Total annual household electricity grid consumption increased on the previous year by 346 kWh or 34% to 1374 kWh, again derived from reading the electricity meter. The monthly grid electricity consumption data are shown in Fig.3. The chart shows clearly during this full year with the EES system, that during the summer months grid consumption for the home is greatly reduced by the combination of solar generation and battery discharge. Conversely, during the winter months, grid consumption increases due to battery charging and reduced solar generation. However, as outlined in 2018, most of this consumption is drawn at night giving benefit to grid balancing, and benefits the consumer through lower cost time-of-use (ToU) tariffs. In carbon terms, nighttime charging is also desirable as the carbon intensity is lower, however this is not reflected in the footprint as an annual average carbon intensity figure is used.

Fig.3. Monthly grid electricity consumption data.

The assumption was made that only 25% of solar generation was exported, and 75% was consumed on-site. Therefore, 1374 kWh grid consumption minus 391 kWh solar export resulted in a net grid electricity consumption of 983 kWh. Grid electricity was given a carbon intensity figure of 0.278 kgCO2e/kWh (DECC, 2019) for a 2019 generation mix. The combined solar self-consumption and exported generation resulted in an emission increase of 200 kgCO2e to 270 kgCO2e or 0.27 tCO2e.

Space and Water Heating

Total annual household gas consumption increased by 7% on the previous year to 6011 kWh, derived from monthly meter readings, shown as a column chart in Fig.4. All consumption was provided by the gas grid, and given a carbon intensity figure of 0.204 kgCO2e/kWh (DECC, 2019). This resulted in an increase of 83kgCO2e to 1226 kgCO2e or 1.2 tCO2e emissions.

Fig.4. Monthly gas consumption data.

Car Travel

The car in use was a battery electric vehicle (BEV). The annual mileage estimated to the nearest 1000 reduced to 13000 miles, or 21000 km. As the fuel is electricity, the carbon intensity figure of fuel production and use in an electric vehicle is the same as is given for grid electricity, which this year was 0.278 kgCO2e/kWh (DECC, 2019) for a 2019 generation mix. The car consumed 2856 kWh of electricity to charge, derived from monthly readings of the night time consumption meter and shown as a column chart in Fig.5., resulting in a reduction in fuel production emissions only to 798 kgCO2e or 0.8 tCO2e.

Note: In the units previously given for vehicle emissions, 2019 grid electricity equates to 0.038 kgCO2e/km.

Fig.5. Monthly car charging data.

Water Consumption

Total annual household water consumption remained at 19 m3, derived from a utility bill for that year. The 2019 carbon intensity figure of domestic water supply (0.344 kgCO2e/m3), and treatment (0.708 kgCO2e/m3) is given as 1.052 kgCO2e/m3 (DECC, 2019). This resulted in no change at 0.02 tCO2e emissions.

Lifestyle

There were no additional lifestyle changes this year, and those already made continued which did not affect the results for lifestyle in the carbon footprint calculator (WWF, 2019), so emissions remained at 0.5 tCO2.

Infrastructure

The figure for infrastructure emissions in the carbon footprint calculator (WWF, 2019) remained at 2.75 tCO2 for each UK citizen. The annual donation to the Woodland Trust to plant 25 m2 of woodland, and the 14 trees planted off-set and sequester -1.14 tCO2 of these indirect emissions.

Behaviours

All previous behaviours continued, with the only addition being the management of the EES battery system along with a ToU tariff to maximise charging and discharging regimes to reduce peak-time grid consumption, cost, and emissions, and maximise electricity storage from solar and off-peak surplus grid power.

Conclusions

Overall, emissions increased slightly compared to the previous year by 2% or 0.1 tCO2e, resulting in 59% or 6.3 tCO2e lower compared to the baseline year. The increase was due to a slight increase in gas consumption for space heating. A further increase could have resulted from lower solar generation and increased winter electricity consumption to charge the EES battery, however this was avoided due to a further reduction in the carbon intensity of grid electricity as more renewable generators were again added to the mix, and a reduction in mileage reduced the emissions from car travel. Water use remained stable at a low level.

Octopus Energy Referral code worth £50,  https://share.octopus.energy/oak-moose-437

References

The Department for Energy and Climate Change (2019). Greenhouse gas reporting – Conversion factors 2019. Available at: Greenhouse gas reporting: conversion factors 2019 – GOV.UK (www.gov.uk) (accessed 14th December 2023).

WWF-UK (2019). Available at: WWF Footprint Calculator (accessed January 2020).

The Road to Carbon-Zero 2018 – The Electrical Energy Storage (EES) House Battery

Overview

In June 2018, the 4 kWh Powervault EES system was commissioned, with the purpose of storing and using more of the solar power generated on-site. The grid-connected EES and energy management system consists of six 110 Ah (Amp-hour) 12 V (Volt) or 1.3 kWh lead-acid gel, tubular plate, deep-cycle, deep discharge batteries, the type typically used for caravans, motorhomes, and similar applications. The 7.8-kWh capacity facilitates 4 kWh of usable power, ensuring the batteries are rarely discharged below 50%, and never close to the maximum depth of discharge of 80%. The typical maximum cycle-life of these batteries is 1500 cycles, equivalent to four years of one charge/discharge cycle per day. However, preventing the depth of discharge exceeding 50% regularly through a higher storage capacity than that needed, intends to extend this usable life to five or six years. The carbon fingerprint is shown in Fig.1. in comparison with previous years and baseline.

Fig.1. The fingerprint of CO2e emissions in 2018, in comparison with previous years and baseline.

Solar Power Generation

The total solar power generation for the year increased considerably on the previous year by 116 kWh to 1612 kWh, well above the six-year average, derived from reading the generation meter. The monthly solar generation data are shown in Fig.2., highlighting the increased solar irradiance in May, June, and July this year.

Fig.2. Monthly solar generation data.

Household Electricity Consumption

Total annual household electricity grid consumption was reduced on the previous year by 161 kWh or 14% to 1028 kWh, again derived from reading the electricity meter. This was due to the increased solar generation, and the connection of the Electrical Energy Storage Battery at the end of June, shown in Fig.3.

Fig.3. The 4 kWh EES system, similar in size to a dishwasher, located under the stairs.

The monthly grid electricity consumption data are shown in Fig.4. Using the five-year average trendline shows the dramatic reduction of grid electricity consumed during the summer, due to the discharge of stored solar power from the battery, and an increase in grid consumption during the winter, due to charging the battery overnight. However, this higher overnight consumption is good for grid balancing as there is often a surplus of power at night from low-carbon sources like wind, and is also at a cheaper rate for the consumer to purchase than the daytime rate.

Fig.4. Monthly grid electricity consumption data.

The assumption of 25% solar self-consumption had to be revised this year. Monitoring of the solar/grid/battery system in later years determined that with the battery connected only 25% of solar generation was exported, and 75% was consumed on-site. However, the battery was installed half way through this year, so the assumption was made that solar self-consumption was 50%. Therefore, 1028 kWh grid consumption minus 806 kWh solar export resulted in a net grid electricity consumption of 222 kWh. Grid electricity was given a carbon intensity figure of 0.307 kgCO2e/kWh (DECC, 2018) for a 2018 generation mix. The combined solar self-consumption and exported generation resulted in an emission increase of 42 kgCO2e to 68 kgCO2e or 0.07 tCO2e.

Note: The data does not display the benefits of the battery to the grid system of increased consumption using less carbon intense off-peak overnight power to reduce peak-time high carbon power use from the grid (load shifting), and reducing wind power curtailment.

Space and Water Heating

Total annual household gas consumption increased by 16% on the previous year to 5601 kWh, derived from monthly meter readings, shown as a column chart in Fig.5. The chart shows the increase was likely due to cooler than average Spring and Autumn seasons. All consumption was provided by the gas grid, and given a carbon intensity figure of 0.204 kgCO2e/kWh (DECC, 2018). This resulted in an increase of 153kgCO2e to 1143 kgCO2e or 1.1 tCO2e emissions.

Fig.5. Monthly gas consumption data.

Car Travel

The car in use was a battery electric vehicle (BEV). The annual mileage estimated to the nearest 1000 remained at 14000 miles, or 22000 km. As the fuel is electricity, the carbon intensity figure of fuel production and use in an electric vehicle is the same as is given for grid electricity, which this year was 0.307 kgCO2e/kWh (DECC, 2018) for a 2018 generation mix. The car consumed 3148 kWh of electricity to charge, well above the four-year average, derived from monthly readings of the night time consumption meter and shown as a column chart in Fig.6., but resulted in a reduction in fuel production emissions only to 968 kgCO2e or 1.0 tCO2e, due to the lower carbon intensity of grid electricity. 

Note: In the units previously given for vehicle emissions, 2018 grid electricity equates to 0.044 kgCO2e/km.

Fig.6. Monthly car charging data.

Water Consumption

Total annual household water consumption was reduced to 19 m3, derived from a utility bill for that year. The 2018 carbon intensity figure of domestic water supply (0.344 kgCO2e/m3), and treatment (0.708 kgCO2e/m3) is given as 1.052 kgCO2e/m3 (DECC, 2018). This resulted in a reduction of 12 kgCO2e to 20 kgCO2e or 0.02 tCO2e emissions.

Lifestyle

There were no additional lifestyle changes this year, and those already made continued which did not affect the results for lifestyle in the carbon footprint calculator (WWF, 2018), so emissions remained at 0.5 tCO2.

Infrastructure

The figure for infrastructure emissions in the carbon footprint calculator (WWF, 2018) remained at 2.75 tCO2 for each UK citizen. The annual donation to the Woodland Trust to plant 25 m2 of woodland, and the 14 trees planted off-set and sequester -1.14 tCO2 of these indirect emissions.

Behaviours

All previous behaviours continued, with the only addition being the management of the EES battery system to maximise charging and discharging regimes to reduce peak-time grid consumption, cost, and emissions, and maximise electricity storage from solar and off-peak surplus grid power.

Conclusions

Overall, emissions remained the same compared to the previous year, and 59% or 6.4 tCO2e lower compared to the baseline year. The increases in gas and grid electricity emissions (due to increased solar self-consumption resulting in less export to the grid) were negated by a large reduction in the emission factor for grid electricity as more renewable generators were again added to the mix, which greatly reduced the emissions from car travel in particular. A further contribution came from a reduction in water use.

References

The Department for Energy and Climate Change (2018). Greenhouse gas reporting – Conversion factors 2018. Available at: Greenhouse gas reporting: conversion factors 2018 – GOV.UK (www.gov.uk) (accessed 20 January 2019).

WWF-UK (2018). Available at: WWF Footprint Calculator (accessed 20 January 2019).

The Road to Carbon-Zero 2017 – Five Years of Primary Empirical Data

Overview

Again, there were no significant carbon reducing measures taken in 2017, although some small reductions were still achieved. However, the recorded data did provide an opportunity to see how this year’s electricity and gas consumption, and solar generation compared to the five-year average from 2013-2017, and a three-year average from 2015-2017 for car charging electricity consumption. The carbon fingerprint is shown in Fig.1. in comparison with previous years and baseline.

Fig.1. The fingerprint of CO2e emissions in 2017, in comparison with previous years and baseline.

Solar Power Generation

The total solar power generation for the year decreased slightly by 45 kWh to 1496 kWh, derived from reading the generation meter, and was well below the five-year average of 1570 kWh. The monthly solar generation data are shown in Fig.2.

Fig.2. Monthly solar generation data.

Household Electricity Consumption

Total annual household electricity grid consumption was reduced on the previous year by 111 kWh or 9% to 1189 kWh, again derived from reading the electricity meter. This was also below the five-year average. The monthly grid electricity consumption data are shown in Fig.3.

Fig.3. Monthly grid electricity consumption data.

Using the assumption of 25% solar self-consumption, this year, 1189 kWh grid consumption minus 1122 kWh solar export resulted in a net grid electricity consumption of 67 kWh. Grid electricity was given a carbon intensity figure of 0.385 kgCO2e/kWh (DECC, 2017) for a 2017 generation mix. The combined solar self-consumption and exported generation resulted in an emissions reduction of 39 kgCO2e to 26 kgCO2e or 0.03 tCO2e.

Space and Water Heating

Total annual household gas consumption decreased by 18% on the previous year to 4830 kWh, derived from monthly meter readings, shown as a column chart in Fig.4. The chart reveals a warmer Spring season compared to the average and much warmer than the previous year, resulting in the lower-than-average gas consumption. All consumption was provided by the gas grid, and given a carbon intensity figure of 0.205 kgCO2e/kWh (DECC, 2017). This resulted in a decrease of 216kgCO2e to 990 kgCO2e or 1.0 tCO2e emissions.

Fig.4. Monthly gas consumption data.

Car Travel

The car in use was a battery electric vehicle (BEV). The annual mileage estimated to the nearest 1000 increased to 14000 miles, or 22000 km. As the fuel is electricity, the carbon intensity figure of fuel production and use in an electric vehicle is the same as is given for grid electricity, which this year was 0.385 kgCO2e/kWh (DECC, 2017) for a 2017 generation mix. The car consumed 3033 kWh of electricity to charge, well above the three-year average, derived from monthly readings of the night time consumption meter and shown as a column chart in Fig.5., resulting in an increase in fuel production emissions only to 1168 kgCO2e or 1.2 tCO2e.

Note: In the units previously given for vehicle emissions, 2017 grid electricity equates to 0.053 kgCO2e/km.

Fig.5. Monthly car charging data.

Water Consumption

Total annual household water consumption remained at 30 m3 derived from a utility bill for that year. The 2017 carbon intensity figure of domestic water supply (0.344 kgCO2e/m3), and treatment (0.708 kgCO2e/m3) is given as 1.052 kgCO2e/m3 (DECC, 2017). This resulted in no change and emissions remained at 0.03 tCO2e.

Lifestyle

Other measures, in addition to reducing carbon emissions, need to be taken to both mitigate and adapt to climate change. When the driveway surface was renewed this year, the ‘Albedo’ or reflectiveness of the surface was considered. The new driveway, Fig.6., is a permeable gravel/resin in a beach sand colour, which not only reflects sunlight and heat, but is also a sustainable drainage system (SuDS) allowing rainwater to penetrate it in heavy rainfall events, alleviating local surface run-off. Whilst this does not reduce carbon and did not affect the results for lifestyle in the carbon footprint calculator (WWF, 2017), maintaining emissions at 0.5 tCO2, it is an important and necessary climate change adaptation for domestic dwellings.

Fig.6. The reflective sustainable drainage system (SuDS) driveway.

Infrastructure

The figure for infrastructure emissions in the carbon footprint calculator (WWF, 2017) remained at 2.75 tCO2 for each UK citizen. The annual donation to the Woodland Trust to plant 25 m2 of woodland, and the 14 trees planted off-set and sequester -1.14 tCO2 of these indirect emissions.

Behaviours

In September of this year, I began a Master’s Degree course in Sustainability in Energy Provision and Demand Management at the Graduate School of the Environment based at the Centre for Alternative Technology and University of East London. All previous behaviours continued, although more time was spent away from home for various reasons.

Conclusions

There was an overall emissions reduction of 4% or 0.2 tCO2e compared to the previous year, and 59% or 6.4 tCO2e compared to the baseline year. This was due to reductions in grid electricity consumption, despite lower solar generation, and in gas consumption, due mostly to a warmer spring, and water consumption remained the same as the previous year. However, vehicle travel emissions increased with an increase in mileage, although this was alleviated somewhat due to a lower emission factor for grid electricity as more renewable generators were again added to the mix. More time spent away from home accounted for the lower electricity consumption, increase in travel mileage, and some of the lower gas consumption.

References

The Department for Energy and Climate Change (2017). Greenhouse gas reporting – Conversion factors 2017. Available at: Greenhouse gas reporting: conversion factors 2017 – GOV.UK (www.gov.uk) (accessed January 2018).

WWF-UK (2018). Available at: WWF Footprint Calculator (accessed January 2018).

The Road to Carbon-Zero 2016  – Smashing the National Average  

Overview

By 2016, all the main areas to reduce CO2 had been addressed. According to the WWF carbon calculator, per capita emissions for a UK citizen stood at 12.2 Tons per year, (WWF,2016). The changes made so far had delivered a 63% reduction to the annual national average, and a 58% or 6.2 tCO2e annual reduction to my baseline year at this point. All areas were stabilising at a lower level as was the total footprint at around 4.5 Tons per year, and there were no significant carbon reducing measures taken in 2016, although some small reductions were still achieved. The carbon fingerprint is shown in Fig.1. in comparison with previous years and baseline. 

Fig.1. The fingerprint of CO2e emissions in 2016, in comparison with previous years and baseline.

Solar Power Generation

The total solar power generation for the year decreased by 72 kWh to 1541 kWh, derived from reading the generation meter. The monthly solar generation data are shown in Fig.2.

Fig.2. Monthly solar generation data.

Household Electricity Consumption

Total annual household electricity grid consumption was reduced on the previous year by 127 kWh or 9% to 1300 kWh, again derived from reading the electricity meter. The monthly grid electricity consumption data are shown in Fig.3.

Fig.3. Monthly grid electricity consumption data.

Using the assumption of 25% solar self-consumption, this year, 1300 kWh grid consumption minus 1156 kWh solar export resulted in a net grid electricity consumption of 144 kWh. Grid electricity was given a carbon intensity figure of 0.449 kgCO2e/kWh (DECC, 2016) for a 2016 generation mix. The combined solar self-consumption and exported generation resulted in an emission reduction of 44 kgCO2e to 65 kgCO2e, holding the footprint value at 0.1 tCO2e.

Space and Water Heating

Total annual household gas consumption increased by 20% on the previous year to 5914 kWh, derived from monthly meter readings, shown as a column chart in Fig.4. All consumption was provided by the gas grid, and given a carbon intensity figure of 0.204 kgCO2e/kWh (DECC, 2016). This resulted in an increase of 197kgCO2e to 1206 kgCO2e or 1.2 tCO2e emissions. As the chart shows, this increase was due to a cold start to the year and a cold spring season.

Fig.4. Monthly gas consumption data.

Car Travel

The car in use was a battery electric vehicle (BEV). The annual mileage estimated to the nearest 1000 decreased to 11000 miles, or 18000 km. As the fuel is electricity, the carbon intensity figure of fuel production and use in an electric vehicle is the same as is given for grid electricity, which this year was 0.449 kgCO2e/kWh (DECC, 2016) for a 2016 generation mix. The car consumed 2402 kWh of electricity to charge, derived from monthly readings of the night time consumption meter and shown as a column chart in Fig.5., resulting in fuel production emissions only of 1079 kgCO2e or 1.1 tCO2e.

Note: In the units previously given for vehicle emissions, 2016 grid electricity equates to 0.06 kgCO2e/km.

Fig.5. Monthly car charging data.

Water Consumption

Total annual household water consumption was reduced to 30 m3, derived from a utility bill for that year. The 2016 carbon intensity figure of domestic water supply (0.344 kgCO2e/m3), and treatment (0.708 kgCO2e/m3) is given as 1.052 kgCO2e/m3 (DECC, 2016). This resulted in a reduction of 2 kgCO2e to 32 kgCO2e, holding the footprint value at 0.03 tCO2e emissions.

Lifestyle

A small measure taken in this year, was the replacement of a petrol-powered lawn mower with a battery-powered robotic mower, pictured in Fig.6. The new device trimmed the large lawn using stored solar power generated by the rooftop array. The result being this was the last year that I had to purchase any petrol. This did not affect the results in the carbon footprint calculator (WWF, 2016), so emissions remained at 0.5 tCO2.

Fig.6. The robotic lawn mower in its charging station.

Infrastructure

The figure for infrastructure emissions in the carbon footprint calculator (WWF, 2016) remained at 2.75 tCO2 for each UK citizen. Two more trees were planted at home in this year, bringing the total to 14, and together with the annual donation to the Woodland Trust to plant 25 m2 of woodland, will off-set and sequester -1.14 tCO2 of these indirect emissions.

Behaviours

By this year, most of the behavioural changes to affect a more sustainable existence personally had taken place and were being maintained. However, through the charities that I was supporting, I began to be more active in political lobbying of my local representatives, to try to have a wider positive impact on environmental issues, such as climate change and carbon emission reduction. To help promote this, in May I joined Twitter at @EcofuturistUK.

Conclusions

There was an overall emissions reduction of 2% or 0.1 tCO2e compared to the previous year, and 58% or 6.2 tCO2e compared to the baseline year. There were reductions in grid consumption and vehicle travel emissions, in part due to a lower emission factor for grid electricity as more renewable generators were added to the mix. However, these were cancelled out by lower solar generation and higher gas consumption. There was also a slight decrease in water use, which does not show in the fingerprint.The actual difference between the 2015 and 2016 footprints was the 20 kgCO2 sequestered from the planting of two trees, and this resulted in a rounding down of the footprint by the 0.1 tCO2e figure.

References

The Department for Energy and Climate Change (2016). Greenhouse gas reporting – Conversion factors 2016. Available at: https://www.gov.uk/government/publications/greenhouse-gas-reporting-conversion-factors-2016 (accessed January 2017).

WWF-UK (2016). Available at: WWF Footprint Calculator (accessed January 2017).