Overview
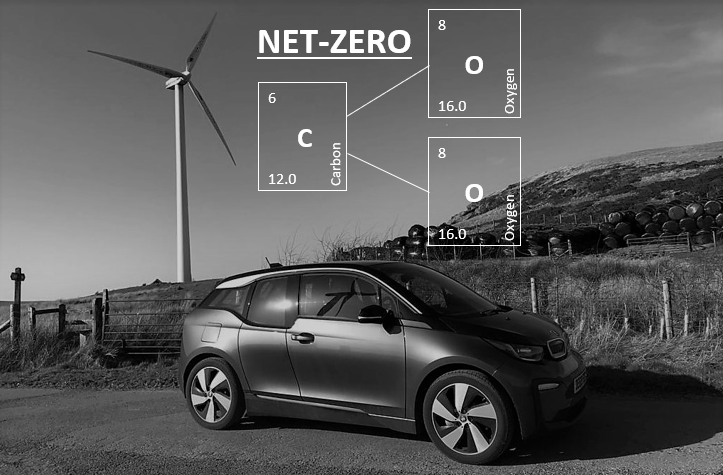
In March, the Ripple Energy Graig Fatha Wind Turbine project, the UK’s first consumer-owned renewable energy generation source, came on-line and began generating zero-carbon electricity. In addition, in July a new 1 kWp secondary solar array was installed on the south-west facing roof of the garage, and the car charging point on the side of the house was replaced with a ‘smarter’ device which enables the car to charge directly from solar generation with no grid input. These measures resulted in net-zero emissions for total electricity use for the first time. The carbon fingerprint is shown in Fig.1. in comparison with previous years and baseline.

Fig.1. The fingerprint of CO2e emissions in 2022, in comparison with previous years and baseline.
Solar Power Generation
The total solar power generation for the year increased by 449 kWh to 1961 kWh, mainly due to the new 1 kW secondary array shown in Fig.3., but also higher solar irradiance. Data were derived from reading the generation meters. The monthly solar generation data are shown in Fig.2.
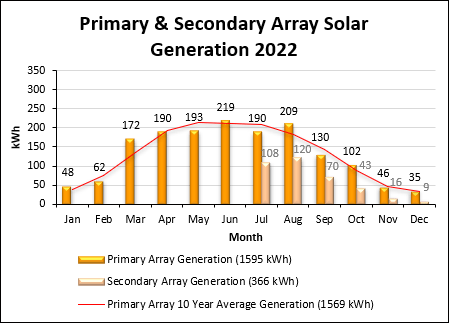
Fig.2. Monthly solar generation data.
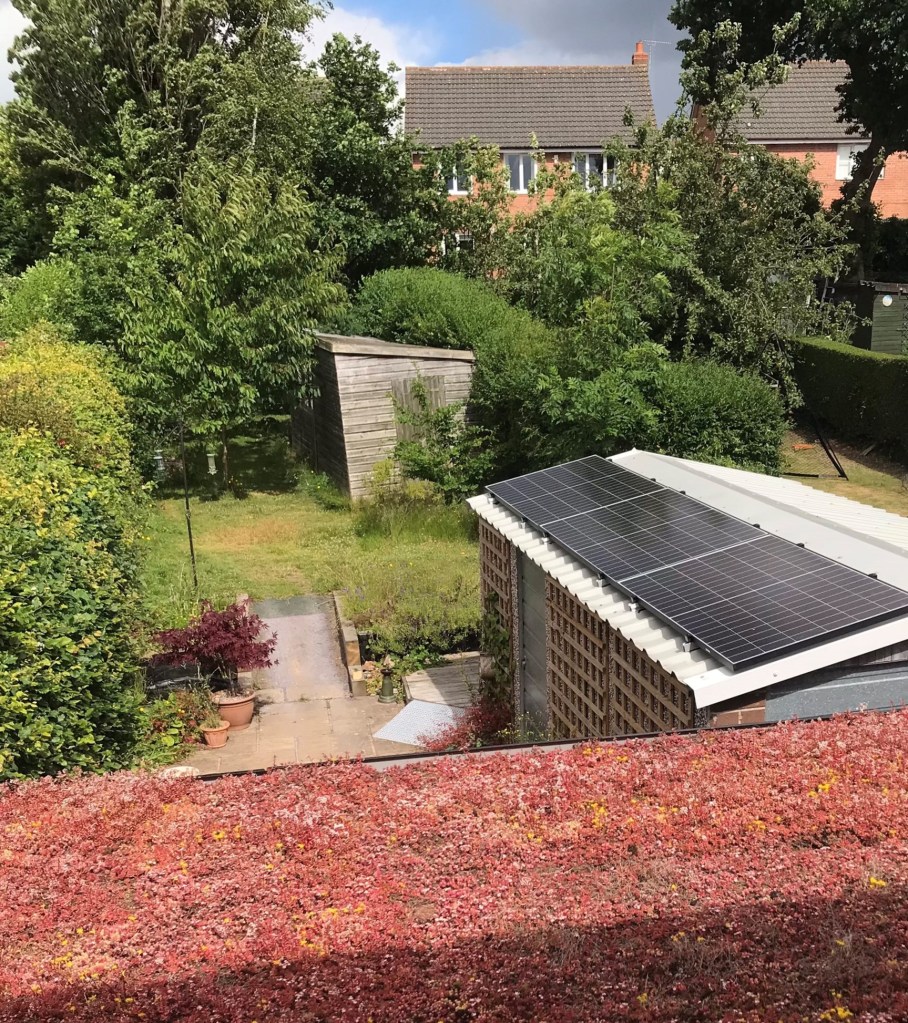
Fig.3. The secondary 1 kWp solar array on the south-west facing garage roof. Maturing planted trees and green roof are also in view.
Wind Power Generation
The total wind power generation from my ownership share in the Graig Fatha turbine (Fig.5.), for this part-year was 3195 kWh, displacing this amount of conventional grid electricity generation with carbon intensity of 0.211 kgCO2e/kWh (DECC, 2022) for a 2022 generation mix. This resulted in an emission off-set of 674 kgCO2e or 0.7 tCO2e. The monthly wind generation data were derived from my personal Ripple dashboard, and are shown in Fig.4.
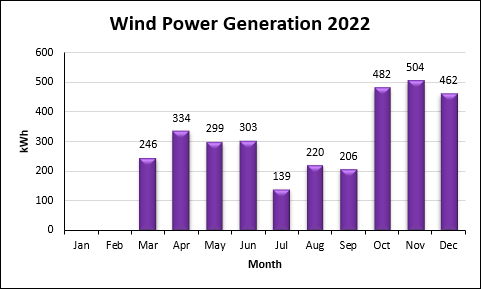
Fig.4. Monthly wind power generation data.
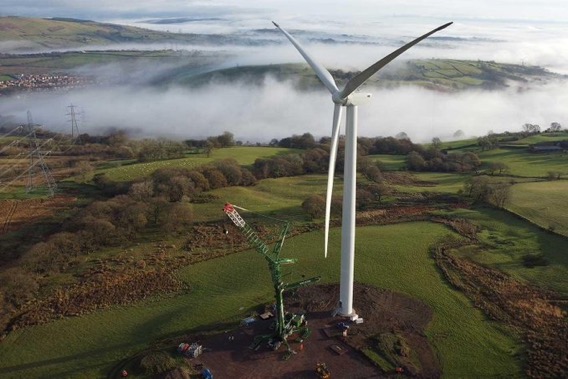
Fig.5. Graig Fatha, consumer-owned 2 Mega-Watt wind turbine. (Photo source: Ripple Energy)
Household Electricity Consumption
Total annual household electricity grid consumption was reduced on the previous year by 36 kWh or 3% to 1200 kWh, again derived from reading the electricity meter. The monthly grid electricity consumption data are shown in Fig.6.

Fig.6. Monthly grid electricity consumption data.
The assumption was made that only 25% of solar generation was exported, and 75% was consumed on-site. Therefore, 1200 kWh grid consumption minus 490 kWh solar export resulted in a net grid electricity consumption of 710 kWh. Grid electricity was given a carbon intensity figure of 0.211 kgCO2e/kWh (DECC, 2022) for a 2022 generation mix. The combined solar self-consumption and exported generation resulted in an emission decrease of 48 kgCO2e to 150 kgCO2e or 0.2 tCO2e.
Space and Water Heating
Total annual household gas consumption decreased by 3% on the previous year to 4926 kWh, derived from monthly meter readings, shown as a column chart in Fig.7. All consumption was provided by the gas grid, and given a carbon intensity figure of 0.2 kgCO2e/kWh (DECC, 2022). This resulted in a decrease of 45kgCO2e to 985 kgCO2e, stabilising emissions at 1.0 tCO2e.

Fig.7. Monthly gas consumption data.
Car Travel
The car in use was a battery electric vehicle (BEV). The annual mileage estimated to the nearest 1000 decreased on the previous year to 12000 miles, or 19000 km. As the fuel is electricity, the carbon intensity figure of fuel production and use in an electric vehicle is the same as is given for grid electricity, which this year was 0.211 kgCO2e/kWh (DECC, 2022) for a 2022 generation mix. The car consumed 2464 kWh of electricity to charge, derived from monthly readings of the night time consumption meter and shown as a column chart in Fig.8., resulting in a decrease in fuel production emissions only to 520 kgCO2e or 0.5 tCO2e.
Note: In the units previously given for vehicle emissions, 2022 grid electricity equates to 0.027 kgCO2e/km.
The new charging device, shown in Fig.9., was supplied by the same company that produce the energy monitoring system, OpenEnergyMonitor, therefore enabling the two devices to talk to each other, and allowing charging to start and stop with changes in solar generation.
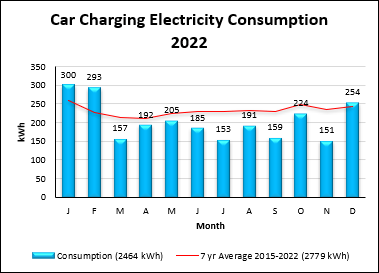
Fig.8. Monthly car charging data. (Note: 7-year average excludes 2020 due to pandemic lock-down anomaly).
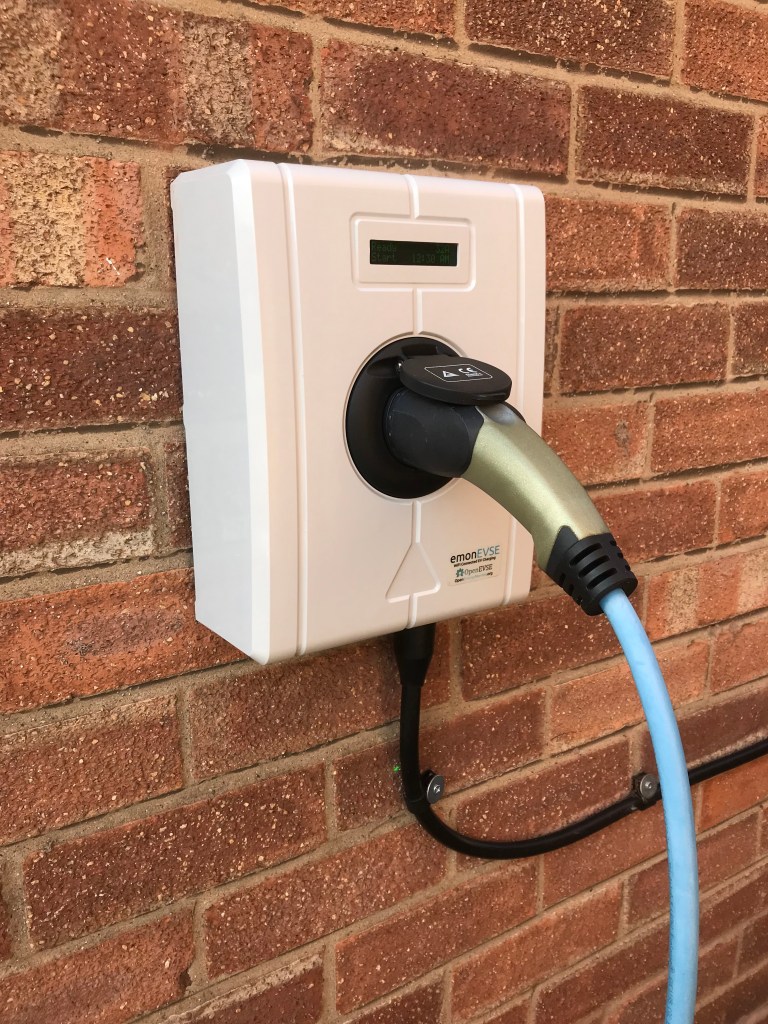
Fig.9. The smart car charging point by OpenEnergyMonitor on the side of the house.
Water Consumption
Total annual household water consumption was reduced to 10 m3, derived from a utility bill for that year. The 2022 carbon intensity figure of domestic water supply (0.149 kgCO2e/m3), and treatment (0.272 kgCO2e/m3) is given as 0.421 kgCO2e/m3 (DECC, 2022). This resulted in a 20% reduction of 1 kgCO2e to 4 kgCO2e or 0.0 tCO2e emissions.
Adapting to Climate Change Update
On 18 July, a new provisional national temperature record for Wales of 37.1°C was recorded at Hawarden Airport, Flintshire, just three miles from my home. At 2pm the sun was overhead, beaming down on the green roof, and the outside shade temperature peaked at 36.1 oC. The air temperature beneath the green roof was 11 oC cooler than the outside shade, and the inside temperature remained bearable and peaked at 24.9 oC. Furthermore, a bare rubber flat roof in full sun would be more like 60 oC rather than the 36 oC shade temperature.
There is no doubt that the combined measures of loft and cavity wall insulation, A-rated double glazing, green roof, and shutters kept the inside space comfortable in the face of extreme heat. Importantly, no extra energy was used or needed to cool the internal space.
Lifestyle
There were no changes regarding lifestyle in this year, so there was no effect to the results for lifestyle in the carbon footprint calculator (WWF, 2022), and emissions remained at 0.5 tCO2.
Infrastructure
The figure for infrastructure emissions in the carbon footprint calculator (WWF, 2016) remained at 2.75 tCO2 for each UK citizen. The annual donation to the Woodland Trust to plant 25 m2 of woodland, the 14 trees planted, and the green roof and wall off-set and sequester -1.15 tCO2 of these indirect emissions.
Behaviours
The addition of wind generation, second solar array, and smart car charging allowed further behavioural change around electricity use, maximising zero-carbon sources. The additional solar array would enable the car to be charged during the day using peak solar generation in the summer months in the following year. The wind power generation allowed overnight car and house battery charging when the turbine was generating, and a four-day ahead forecast enabled the amount of charging to be increased or decreased accordingly.
Conclusions
Overall, emissions decreased compared to the previous year by 23% or 0.9 tCO2e, resulting in 71% or 7.6 tCO2e lower emissions compared to the baseline year. A reduction in travel mileage accounted for 0.2 tCO2eof the decrease, however the remaining 0.7tCO2e came from wind power generation. In fact, this completely off-set all electricity grid consumption for both the home and travel, and emissions from water consumption were also eliminated, both for the first time in this year.
References
The Department for Energy and Climate Change (2022). Greenhouse gas reporting – Conversion factors 2022. Available at: Greenhouse gas reporting: conversion factors 2022 – GOV.UK (www.gov.uk) (accessed 17th December 2023).
WWF-UK (2021). Available at: WWF Footprint Calculator (accessed January 2023).
