Overview
In this year, measures were taken to adapt to the already noticeable and future impacts of Climate Change. A green wall and green roof were planted to reduce heat absorption of the building and cool the air around the building, whilst also absorbing atmospheric carbon and rainfall and enhancing biodiversity. On the South-East facing windows, plantation shutters were installed, to reduce heat gain in summer and heat loss in winter of the building interior. The carbon fingerprint is shown in Fig.1. in comparison with previous years and baseline.
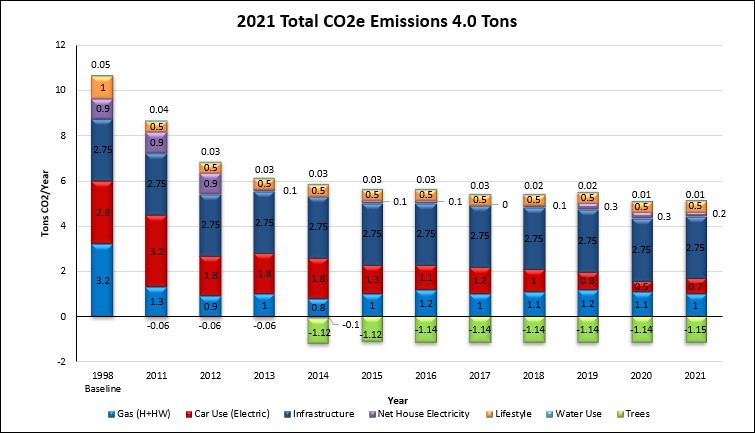
Fig.1. The fingerprint of CO2e emissions in 2021, in comparison with previous years and baseline.
Solar Power Generation
The total solar power generation for the year decreased slightly by 47 kWh to 1512 kWh, derived from reading the generation meter. The monthly solar generation data are shown in Fig.2. Annual generation was lower than the nine-year average, but monthly generation showed a typical pattern apart from a high reading for April.
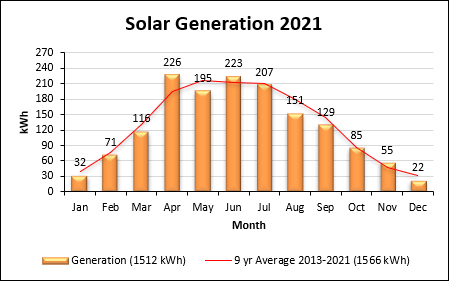
Fig.2. Monthly solar generation data.
Household Electricity Consumption
Total annual household electricity grid consumption was reduced on the previous year by 260 kWh or 17% to 1236 kWh, again derived from reading the electricity meter. The monthly grid electricity consumption data are shown in Fig.3.
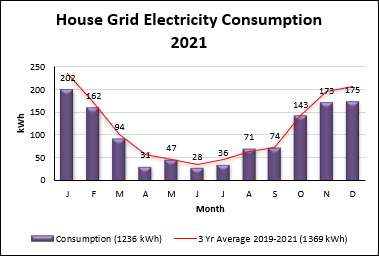
Fig.3. Monthly grid electricity consumption data.
The assumption was made that only 25% of solar generation was exported, and 75% was consumed on-site. Therefore, 1236 kWh grid consumption minus 378 kWh solar export resulted in a net grid electricity consumption of 858 kWh. Grid electricity was given a carbon intensity figure of 0.231 kgCO2e/kWh (DECC, 2021) for a 2021 generation mix. The combined solar self-consumption and exported generation resulted in an emission decrease of 81 kgCO2e to 198 kgCO2e or 0.2 tCO2e.
In July, the Octopus Agile electricity tariff was changed to another ToU tariff Octopus Go, an EV tariff which gives four hours of super cheap electricity to charge the EV and house battery at night, bringing further cost reduction.
Space and Water Heating
Total annual household gas consumption decreased by 8% on the previous year to 5074 kWh, derived from monthly meter readings, shown as a column chart in Fig.4. All consumption was provided by the gas grid, and given a carbon intensity figure of 0.203 kgCO2e/kWh (DECC, 2021). This resulted in a decrease of 95kgCO2e to 1030 kgCO2e or 1.0 tCO2e emissions.
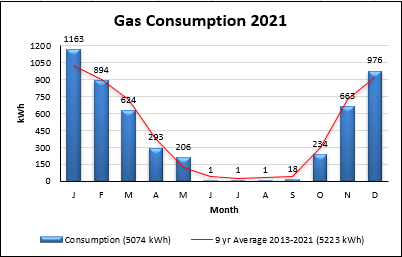
Fig.4. Monthly gas consumption data.
Car Travel
The car in use was a battery electric vehicle (BEV). The annual mileage estimated to the nearest 1000 increased considerably on the previous year back to 14000 miles, or 22000 km. As the fuel is electricity, the carbon intensity figure of fuel production and use in an electric vehicle is the same as is given for grid electricity, which this year was 0.231 kgCO2e/kWh (DECC, 2021) for a 2021 generation mix. The car consumed 3051 kWh of electricity to charge, derived from monthly readings of the night time consumption meter and shown as a column chart in Fig.5., resulting in an increase in fuel production emissions only to 705 kgCO2e or 0.7 tCO2e.
Note: In the units previously given for vehicle emissions, 2021 grid electricity equates to 0.032 kgCO2e/km.
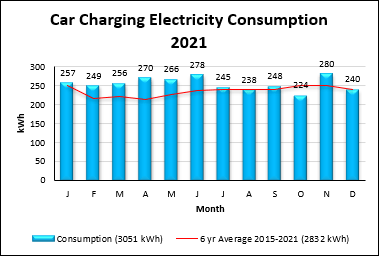
Fig.5. Monthly car charging data. (Note: 6-year average excludes 2020 due to pandemic lock-down anomaly).
Water Consumption
Total annual household water consumption remained at 11 m3, derived from a utility bill for that year. However, the 2021 carbon intensity figure of domestic water supply (0.149 kgCO2e/m3), and treatment (0.272 kgCO2e/m3) given as 0.421 kgCO2e/m3 (DECC, 2021), was reduced by 60% on the previous year. This resulted in an equivalent reduction in emissions of 7 kgCO2e to 5 kgCO2e, but rounding meant emissions remained at 0.01 tCO2e in the footprint.
Adapting to Climate Change & Enhancing Biodiversity
A green wall was planted to cover the walls of the stand-alone garage (Fig.6.). This consisted of native ivy shrubs which, when fully grown, will cover 8m2 of concrete wall. Some low growing shrubs were also planted consisting of box and heat tolerant Mediterranean herbs. This should prevent the South-facing concrete walls of the garage absorbing and storing heat, cooling the space, and will provide a new feeding resource and habitat for many invertebrates and birds.
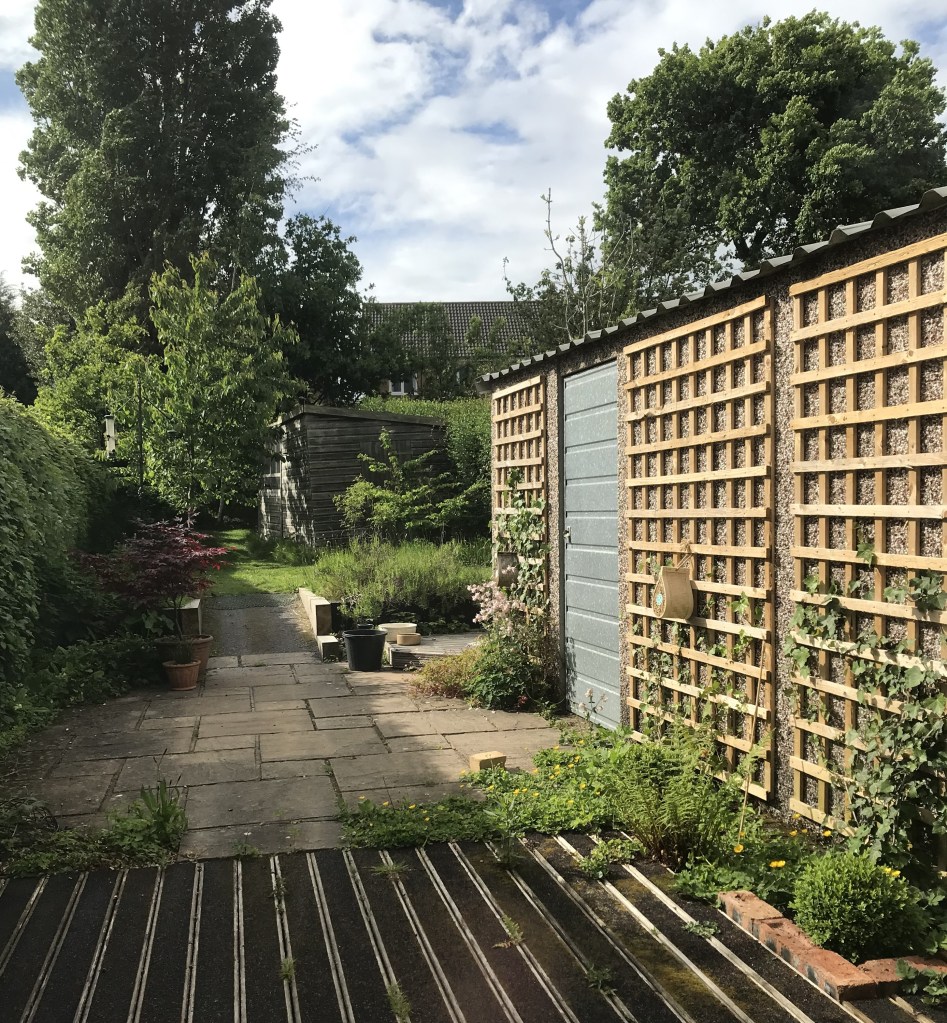
Fig.6. The freshly planted green wall.
A small wildlife pond (Fig.7.) was also created to provide new habitat for aquatic species, particularly frogs and newts. This also reflects sunlight and further cools the space through evaporation in summer, and provides an additional water store throughout the year.

Fig.7. The wildlife pond with flag iris in flower.
To cover an 18m2 area flat-roof extension at the rear of the property, a light-weight extensive sedum green-roof system was installed (Fig.8.). Green roofs provide multiple benefits, such as protecting the external roof layer from UV light and weather damage, prolonging the life of the roof; reducing rain-water run-off rate during heavy rainfall; cooling the air, reducing the urban heat island effect; insulating the roof, reducing internal heat loss in winter and heat gain in summer; enhancing biodiversity through providing an important food resource for pollinators such as native bumble and solitary bees and butterflies during the summer months; and absorbing carbon dioxide from the atmosphere. They are also aesthetically very pleasing, particularly in summer.
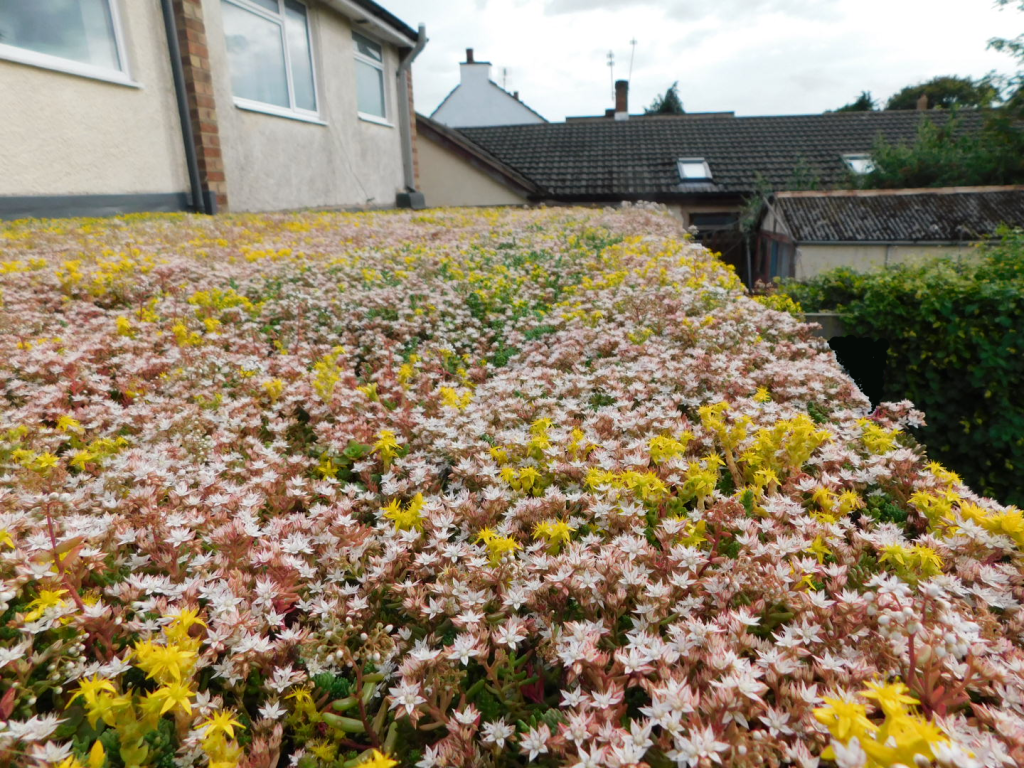
Fig.8. The light-weight extensive sedum green-roof system in full bloom in summer.
Plantation shutters (Fig.9.), in a highly reflective white, were fitted on the front SE facing windows. These were intended to have the double benefit of keeping in heat in winter and heat out in summer. They can also be opened right out to allow passive thermal solar gain during the heating season. Primarily these will have most benefit in winter and some benefit in summer, but with future predictions of higher summer temperatures, the summer benefit should increase.

Fig.9. The plantation shutters, in a highly reflective white, on the front SE facing windows.
Lifestyle & Behaviours
There were no changes regarding lifestyle and behaviours in this year, so there was no effect to the results for lifestyle in the carbon footprint calculator (WWF, 2021), and emissions remained at 0.5 tCO2.
Infrastructure
The figure for infrastructure emissions in the carbon footprint calculator (WWF, 2021) remained at 2.75 tCO2 for each UK citizen. The annual donation to the Woodland Trust to plant 25 m2 of woodland, and the 14 trees planted to off-set and sequester these indirect emissions were joined by a small contribution from the green roof and wall, estimated to be 10 kg per year, resulting in a total value of -1.15 tCO2/year.
Conclusions
Overall, emissions remained stable compared to the previous year, and 63% or 6.7 tCO2e lower compared to the baseline year. Small decreases in emissions for gas consumption and net household electricity use, and further sequestration from added vegetation, were cancelled out by an increase in emissions for car travel as normal mileage resumed compared to the pandemic lock-down restrictions of the previous year. In addition, below average solar generation was countered by a reduction in electricity use.
References
The Department for Energy and Climate Change (2021). Greenhouse gas reporting – Conversion factors 2021. Available at: Greenhouse gas reporting: conversion factors 2021 – GOV.UK (www.gov.uk) (accessed 16th December 2023).
WWF-UK (2021). Available at: WWF Footprint Calculator (accessed January 2022).
