Overview
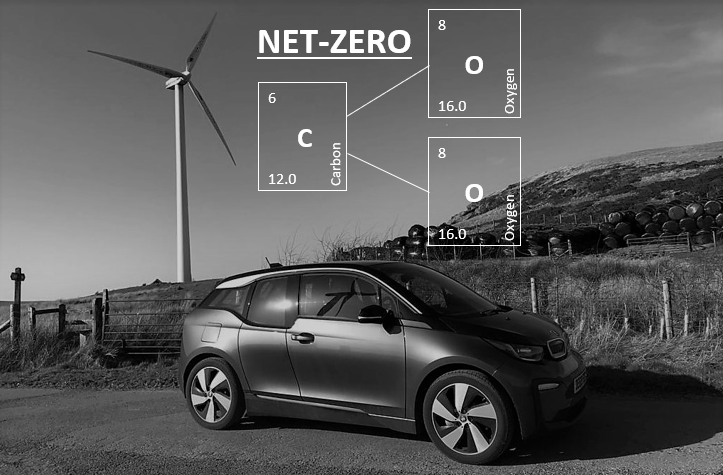
At the end of 2019, the Nissan Leaf was replaced with another battery electric vehicle (BEV), the BMWi3. This BEV had a 42-kWh battery and was lighter and more efficient, which increased the driving range from 90 miles to 240 miles on a single full charge. At the beginning of the year, an energy monitoring system from OpenEnergyMonitor was installed to see the electricity consumption and solar generation in real time to optimise efficiency and further reduce energy cost, grid electricity consumption, and carbon emissions. The Covid-19 pandemic ‘lock-downs’ also had some impact on consumption patterns. The carbon fingerprint is shown in Fig.1. in comparison with previous years and baseline.

Fig.1. The fingerprint of CO2e emissions in 2020, in comparison with previous years and baseline.
Solar Power Generation
The total solar power generation for the year decreased slightly by just 4 kWh to 1559 kWh, derived from reading the generation meter. The monthly solar generation data are shown in Fig.2. Whilst annual generation remained close to the eight-year average, monthly generation showed some unusual variation.
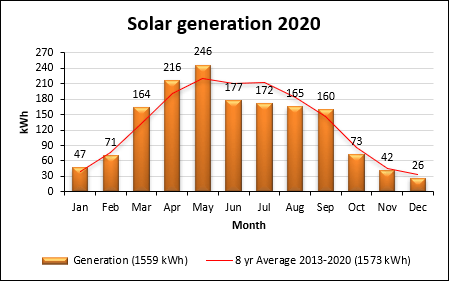
Fig.2. Monthly solar generation data.
Household Electricity Consumption
Total annual household electricity grid consumption increased on the previous year by 122 kWh or 9% to 1496 kWh, again derived from reading the electricity meter. This increase was mainly due to the replacement of the combi-boiler fed shower with an electric version. The monthly grid electricity consumption data are shown in Fig.3., in comparison to the previous year’s consumption, being the first complete data set with the battery system. This highlights the increased grid consumption in June and July due to cloudy conditions reducing solar generation.
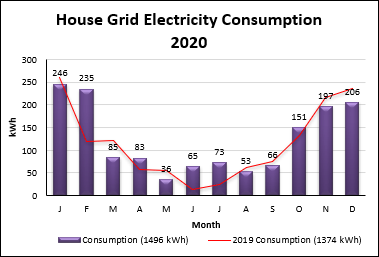
Fig.3. Monthly grid electricity consumption data.
The assumption was made that only 25% of solar generation was exported, and 75% was consumed on-site. Therefore, 1496 kWh grid consumption minus 390 kWh solar export resulted in a net grid electricity consumption of 1106 kWh. Grid electricity was given a carbon intensity figure of 0.253 kgCO2e/kWh (DECC, 2020) for a 2020 generation mix. The combined solar self-consumption and exported generation resulted in an emission increase of 6 kgCO2e to 279 kgCO2e or 0.28 tCO2e.
The figures below show screenshots of two types of electrical energy data monitoring. Fig.4. shows the electricity consumption pattern for one day using Octopus agile ToU tariff. The pink line shows the 30-minute wholesale electricity price, blue bars are grid consumption, yellow bars are solar generation exported, and green bars are solar generation consumed on-site. In this view, the house battery was charged at night and the EV was charged in the afternoon, both to absorb surplus grid power when the electricity price was negative, i.e. getting paid to charge batteries.
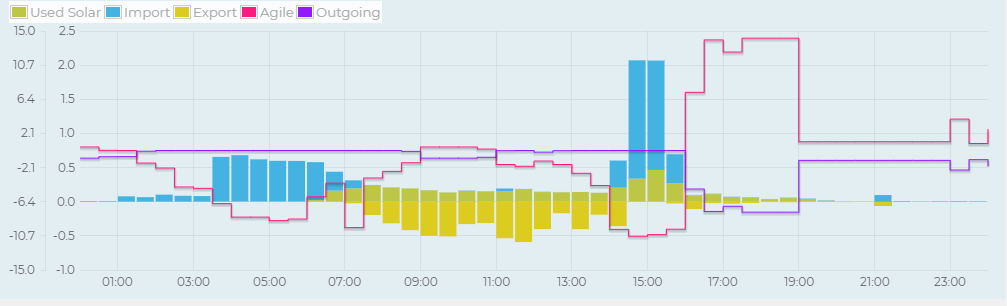
Fig.4. Energy Monitoring ‘Octopus Agile’ App view on 23/05/2020.
The solar generation (Yellow) and electrical consumption (Blue) are shown for the same day using the ‘MY Solar’ App in Fig.5. (note the slightly longer timescale on this view). The full screen view shows real-time values for solar generation, export, and consumption (not shown here). What this day shows is that grid import was high as there was monetary incentive to do so, and solar export was also high as the battery was charged overnight.
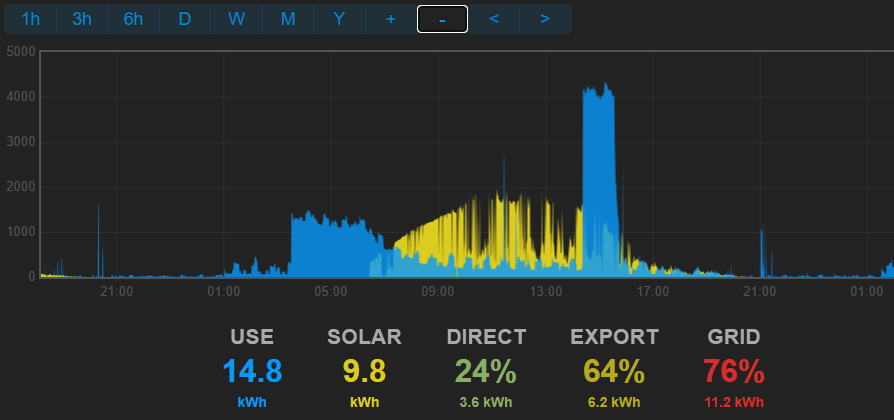
Fig.5. Energy Monitoring ‘My Solar’ App view on 23/05/2020.
Space Heating
Total annual household gas consumption decreased by 8% on the previous year to 5513 kWh, derived from monthly meter readings, shown as a column chart in Fig.6. All consumption was provided by the gas grid, and given a carbon intensity figure of 0.204 kgCO2e/kWh (DECC, 2020). This resulted in a decrease of 101kgCO2e to 1125 kgCO2e or 1.1 tCO2e emissions. The decrease was due to water heating now being supplied by electricity.
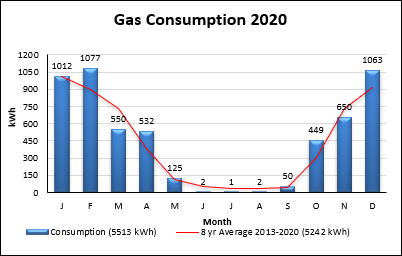
Fig.6. Monthly gas consumption data.
Car Travel
The car in use was a BMWi3 battery electric vehicle (BEV). The annual mileage estimated to the nearest 1000 reduced considerably to 9000 miles, or 15000 km, a consequence of the Covid-19 pandemic travel limitations. As the fuel is electricity, the carbon intensity figure of fuel production and use in an electric vehicle is the same as is given for grid electricity, which this year was 0.253 kgCO2e/kWh (DECC, 2020) for a 2020 generation mix. The car consumed 2014 kWh of electricity to charge, derived from monthly readings of the night time consumption meter and shown as a column chart in Fig.7., which highlights the travel reduction particularly during March-May, resulting in a reduction in fuel production emissions only to 510 kgCO2e or 0.5 tCO2e.
Note: In the units previously given for vehicle emissions, 2020 grid electricity equates to 0.034 kgCO2e/km.

Fig.7. Monthly car charging data.
Water Consumption
Total annual household water consumption was reduced to 11 m3, derived from a utility bill for that year. The 2020 carbon intensity figure of domestic water supply (0.344 kgCO2e/m3), and treatment (0.708 kgCO2e/m3) is given as 1.052 kgCO2e/m3 (DECC, 2020). This resulted in a 40% reduction of 8 kgCO2e to 12 kgCO2e or 0.01 tCO2e emissions.
Lifestyle
In July, an investment was made in Ripple Energy Graig Fatha Wind Turbine project, the UK’s first consumer-owned renewable energy generation source, primarily to get renewable sources built, but with the addition of providing a zero-carbon source of electricity to power the electric car during winter when solar power is minimal, and revenue which will eliminate the electricity bill. This did not affect the results for lifestyle in the carbon footprint calculator (WWF, 2020), so emissions remained at 0.5 tCO2.
Infrastructure
The figure for infrastructure emissions in the carbon footprint calculator (WWF, 2020) remained at 2.75 tCO2 for each UK citizen. The annual donation to the Woodland Trust to plant 25 m2 of woodland, and the 14 trees planted off-set and sequester -1.14 tCO2 of these indirect emissions.
Behaviours
There was a forced behavioural change in this year for health reasons. The bathroom had to be re-modelled to a wet-room for wheelchair access. This meant removal of the bath, and installation of an electric thermostatic shower. The energy implication of this resulted in reducing gas consumption by using battery, solar and grid electricity to heat water for showering, and water consumption was reduced by only taking showers.
Conclusions
Overall, emissions decreased compared to the previous year by 9% or 0.4 tCO2e, resulting in 63% or 6.7 tCO2e lower compared to the baseline year. The decrease was due mostly to reduced travel from the Covid-19 pandemic lock-down travel limitations. There was a further slight decrease in gas consumption for space heating. The reduction would have been greater but was limited by below average solar generation. There was also a significant reduction in water use, due to the removal of the bath.
References
The Department for Energy and Climate Change (2020). Greenhouse gas reporting – Conversion factors 2020. Available at: Greenhouse gas reporting: conversion factors 2020 – GOV.UK (www.gov.uk) (accessed 14th December 2023).
WWF-UK (2020). Available at: WWF Footprint Calculator (accessed January 2021).
