Overview
The first full year with battery storage, and the low-carbon intensity of the grid begins to make electrifying everything viable, combining EV’s, battery storage, and time-of-use (ToU) tariffs. Innovative energy company Octopus introduce several of these ToU tariffs, and switching onto their Agile tariff, which follows the wholesale price of electricity every half hour using the smart meter, enabled being paid to store electricity in the EV and house battery when there is surplus supply on the grid system, usually at night and from wind power sources. In addition, during the evening peak the battery can then be discharged to prevent paying the highest cost to import power. The carbon fingerprint is shown in Fig.1. in comparison with previous years and baseline.
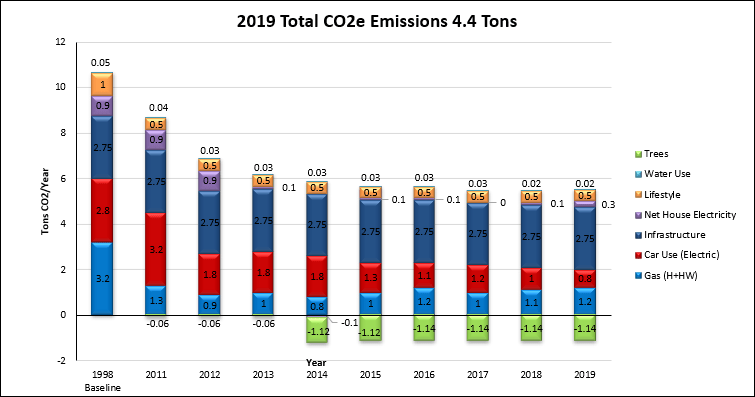
Fig.1. The fingerprint of CO2e emissions in 2019, in comparison with previous years and baseline.
Solar Power Generation
The total solar power generation for the year decreased on the previous year by 49 kWh, back close to the seven-year annual average, to 1563 kWh, derived from reading the generation meter. The monthly solar generation data are shown in Fig.2.
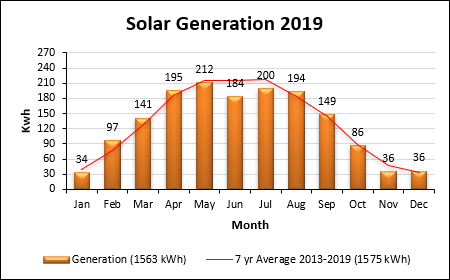
Fig.2. Monthly solar generation data.
Household Electricity Consumption
Total annual household electricity grid consumption increased on the previous year by 346 kWh or 34% to 1374 kWh, again derived from reading the electricity meter. The monthly grid electricity consumption data are shown in Fig.3. The chart shows clearly during this full year with the EES system, that during the summer months grid consumption for the home is greatly reduced by the combination of solar generation and battery discharge. Conversely, during the winter months, grid consumption increases due to battery charging and reduced solar generation. However, as outlined in 2018, most of this consumption is drawn at night giving benefit to grid balancing, and benefits the consumer through lower cost time-of-use (ToU) tariffs. In carbon terms, nighttime charging is also desirable as the carbon intensity is lower, however this is not reflected in the footprint as an annual average carbon intensity figure is used.
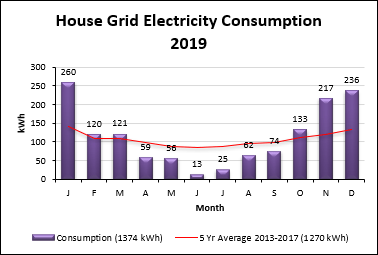
Fig.3. Monthly grid electricity consumption data.
The assumption was made that only 25% of solar generation was exported, and 75% was consumed on-site. Therefore, 1374 kWh grid consumption minus 391 kWh solar export resulted in a net grid electricity consumption of 983 kWh. Grid electricity was given a carbon intensity figure of 0.278 kgCO2e/kWh (DECC, 2019) for a 2019 generation mix. The combined solar self-consumption and exported generation resulted in an emission increase of 200 kgCO2e to 270 kgCO2e or 0.27 tCO2e.
Space and Water Heating
Total annual household gas consumption increased by 7% on the previous year to 6011 kWh, derived from monthly meter readings, shown as a column chart in Fig.4. All consumption was provided by the gas grid, and given a carbon intensity figure of 0.204 kgCO2e/kWh (DECC, 2019). This resulted in an increase of 83kgCO2e to 1226 kgCO2e or 1.2 tCO2e emissions.
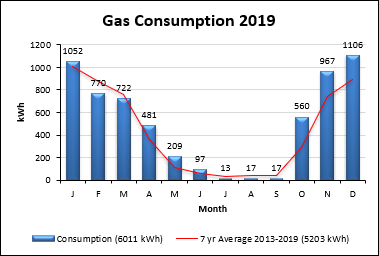
Fig.4. Monthly gas consumption data.
Car Travel
The car in use was a battery electric vehicle (BEV). The annual mileage estimated to the nearest 1000 reduced to 13000 miles, or 21000 km. As the fuel is electricity, the carbon intensity figure of fuel production and use in an electric vehicle is the same as is given for grid electricity, which this year was 0.278 kgCO2e/kWh (DECC, 2019) for a 2019 generation mix. The car consumed 2856 kWh of electricity to charge, derived from monthly readings of the night time consumption meter and shown as a column chart in Fig.5., resulting in a reduction in fuel production emissions only to 798 kgCO2e or 0.8 tCO2e.
Note: In the units previously given for vehicle emissions, 2019 grid electricity equates to 0.038 kgCO2e/km.
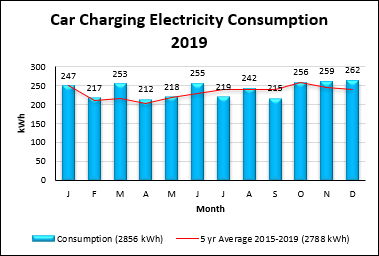
Fig.5. Monthly car charging data.
Water Consumption
Total annual household water consumption remained at 19 m3, derived from a utility bill for that year. The 2019 carbon intensity figure of domestic water supply (0.344 kgCO2e/m3), and treatment (0.708 kgCO2e/m3) is given as 1.052 kgCO2e/m3 (DECC, 2019). This resulted in no change at 0.02 tCO2e emissions.
Lifestyle
There were no additional lifestyle changes this year, and those already made continued which did not affect the results for lifestyle in the carbon footprint calculator (WWF, 2019), so emissions remained at 0.5 tCO2.
Infrastructure
The figure for infrastructure emissions in the carbon footprint calculator (WWF, 2019) remained at 2.75 tCO2 for each UK citizen. The annual donation to the Woodland Trust to plant 25 m2 of woodland, and the 14 trees planted off-set and sequester -1.14 tCO2 of these indirect emissions.
Behaviours
All previous behaviours continued, with the only addition being the management of the EES battery system along with a ToU tariff to maximise charging and discharging regimes to reduce peak-time grid consumption, cost, and emissions, and maximise electricity storage from solar and off-peak surplus grid power.
Conclusions
Overall, emissions increased slightly compared to the previous year by 2% or 0.1 tCO2e, resulting in 59% or 6.3 tCO2e lower compared to the baseline year. The increase was due to a slight increase in gas consumption for space heating. A further increase could have resulted from lower solar generation and increased winter electricity consumption to charge the EES battery, however this was avoided due to a further reduction in the carbon intensity of grid electricity as more renewable generators were again added to the mix, and a reduction in mileage reduced the emissions from car travel. Water use remained stable at a low level.
Octopus Energy Referral code worth £50, https://share.octopus.energy/oak-moose-437
References
The Department for Energy and Climate Change (2019). Greenhouse gas reporting – Conversion factors 2019. Available at: Greenhouse gas reporting: conversion factors 2019 – GOV.UK (www.gov.uk) (accessed 14th December 2023).
WWF-UK (2019). Available at: WWF Footprint Calculator (accessed January 2020).
