Overview
In June 2018, the 4 kWh Powervault EES system was commissioned, with the purpose of storing and using more of the solar power generated on-site. The grid-connected EES and energy management system consists of six 110 Ah (Amp-hour) 12 V (Volt) or 1.3 kWh lead-acid gel, tubular plate, deep-cycle, deep discharge batteries, the type typically used for caravans, motorhomes, and similar applications. The 7.8-kWh capacity facilitates 4 kWh of usable power, ensuring the batteries are rarely discharged below 50%, and never close to the maximum depth of discharge of 80%. The typical maximum cycle-life of these batteries is 1500 cycles, equivalent to four years of one charge/discharge cycle per day. However, preventing the depth of discharge exceeding 50% regularly through a higher storage capacity than that needed, intends to extend this usable life to five or six years. The carbon fingerprint is shown in Fig.1. in comparison with previous years and baseline.
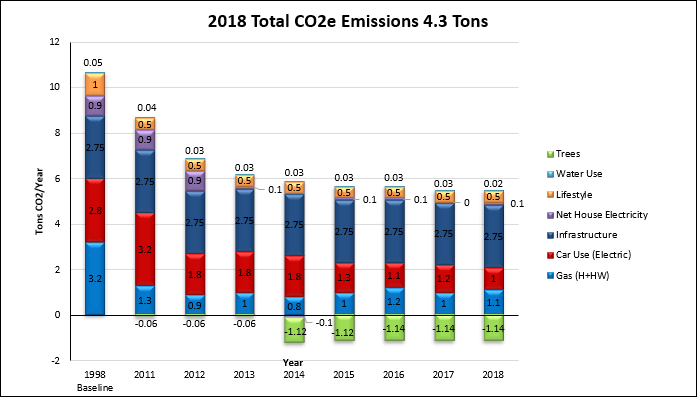
Fig.1. The fingerprint of CO2e emissions in 2018, in comparison with previous years and baseline.
Solar Power Generation
The total solar power generation for the year increased considerably on the previous year by 116 kWh to 1612 kWh, well above the six-year average, derived from reading the generation meter. The monthly solar generation data are shown in Fig.2., highlighting the increased solar irradiance in May, June, and July this year.
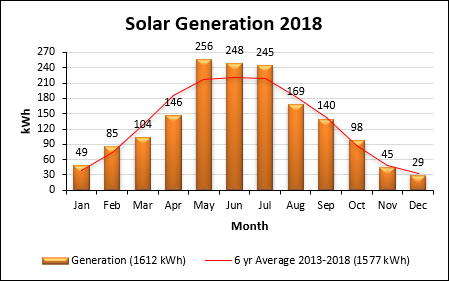
Fig.2. Monthly solar generation data.
Household Electricity Consumption
Total annual household electricity grid consumption was reduced on the previous year by 161 kWh or 14% to 1028 kWh, again derived from reading the electricity meter. This was due to the increased solar generation, and the connection of the Electrical Energy Storage Battery at the end of June, shown in Fig.3.
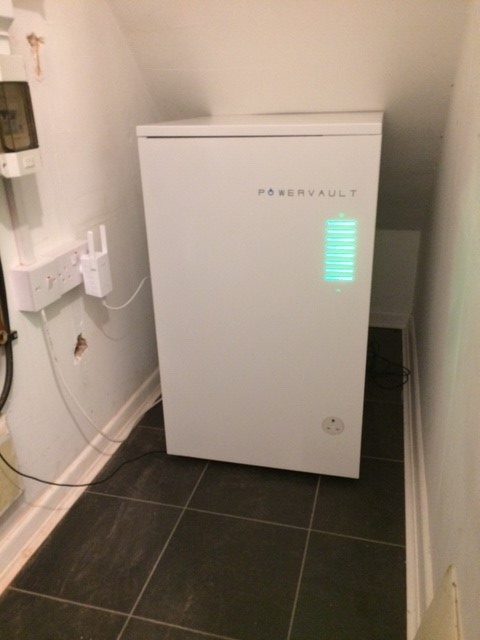
Fig.3. The 4 kWh EES system, similar in size to a dishwasher, located under the stairs.
The monthly grid electricity consumption data are shown in Fig.4. Using the five-year average trendline shows the dramatic reduction of grid electricity consumed during the summer, due to the discharge of stored solar power from the battery, and an increase in grid consumption during the winter, due to charging the battery overnight. However, this higher overnight consumption is good for grid balancing as there is often a surplus of power at night from low-carbon sources like wind, and is also at a cheaper rate for the consumer to purchase than the daytime rate.
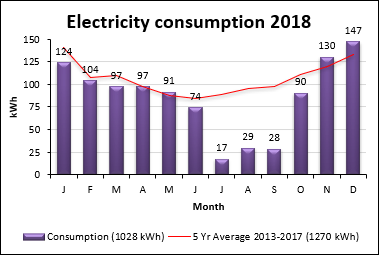
Fig.4. Monthly grid electricity consumption data.
The assumption of 25% solar self-consumption had to be revised this year. Monitoring of the solar/grid/battery system in later years determined that with the battery connected only 25% of solar generation was exported, and 75% was consumed on-site. However, the battery was installed half way through this year, so the assumption was made that solar self-consumption was 50%. Therefore, 1028 kWh grid consumption minus 806 kWh solar export resulted in a net grid electricity consumption of 222 kWh. Grid electricity was given a carbon intensity figure of 0.307 kgCO2e/kWh (DECC, 2018) for a 2018 generation mix. The combined solar self-consumption and exported generation resulted in an emission increase of 42 kgCO2e to 68 kgCO2e or 0.07 tCO2e.
Note: The data does not display the benefits of the battery to the grid system of increased consumption using less carbon intense off-peak overnight power to reduce peak-time high carbon power use from the grid (load shifting), and reducing wind power curtailment.
Space and Water Heating
Total annual household gas consumption increased by 16% on the previous year to 5601 kWh, derived from monthly meter readings, shown as a column chart in Fig.5. The chart shows the increase was likely due to cooler than average Spring and Autumn seasons. All consumption was provided by the gas grid, and given a carbon intensity figure of 0.204 kgCO2e/kWh (DECC, 2018). This resulted in an increase of 153kgCO2e to 1143 kgCO2e or 1.1 tCO2e emissions.
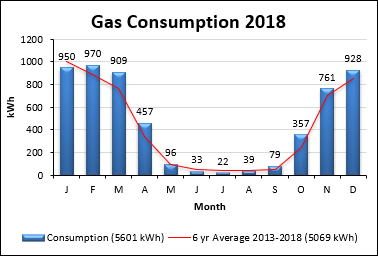
Fig.5. Monthly gas consumption data.
Car Travel
The car in use was a battery electric vehicle (BEV). The annual mileage estimated to the nearest 1000 remained at 14000 miles, or 22000 km. As the fuel is electricity, the carbon intensity figure of fuel production and use in an electric vehicle is the same as is given for grid electricity, which this year was 0.307 kgCO2e/kWh (DECC, 2018) for a 2018 generation mix. The car consumed 3148 kWh of electricity to charge, well above the four-year average, derived from monthly readings of the night time consumption meter and shown as a column chart in Fig.6., but resulted in a reduction in fuel production emissions only to 968 kgCO2e or 1.0 tCO2e, due to the lower carbon intensity of grid electricity.
Note: In the units previously given for vehicle emissions, 2018 grid electricity equates to 0.044 kgCO2e/km.
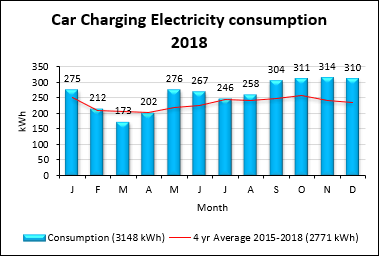
Fig.6. Monthly car charging data.
Water Consumption
Total annual household water consumption was reduced to 19 m3, derived from a utility bill for that year. The 2018 carbon intensity figure of domestic water supply (0.344 kgCO2e/m3), and treatment (0.708 kgCO2e/m3) is given as 1.052 kgCO2e/m3 (DECC, 2018). This resulted in a reduction of 12 kgCO2e to 20 kgCO2e or 0.02 tCO2e emissions.
Lifestyle
There were no additional lifestyle changes this year, and those already made continued which did not affect the results for lifestyle in the carbon footprint calculator (WWF, 2018), so emissions remained at 0.5 tCO2.
Infrastructure
The figure for infrastructure emissions in the carbon footprint calculator (WWF, 2018) remained at 2.75 tCO2 for each UK citizen. The annual donation to the Woodland Trust to plant 25 m2 of woodland, and the 14 trees planted off-set and sequester -1.14 tCO2 of these indirect emissions.
Behaviours
All previous behaviours continued, with the only addition being the management of the EES battery system to maximise charging and discharging regimes to reduce peak-time grid consumption, cost, and emissions, and maximise electricity storage from solar and off-peak surplus grid power.
Conclusions
Overall, emissions remained the same compared to the previous year, and 59% or 6.4 tCO2e lower compared to the baseline year. The increases in gas and grid electricity emissions (due to increased solar self-consumption resulting in less export to the grid) were negated by a large reduction in the emission factor for grid electricity as more renewable generators were again added to the mix, which greatly reduced the emissions from car travel in particular. A further contribution came from a reduction in water use.
References
The Department for Energy and Climate Change (2018). Greenhouse gas reporting – Conversion factors 2018. Available at: Greenhouse gas reporting: conversion factors 2018 – GOV.UK (www.gov.uk) (accessed 20 January 2019).
WWF-UK (2018). Available at: WWF Footprint Calculator (accessed 20 January 2019).
