Overview
Again, there were no significant carbon reducing measures taken in 2017, although some small reductions were still achieved. However, the recorded data did provide an opportunity to see how this year’s electricity and gas consumption, and solar generation compared to the five-year average from 2013-2017, and a three-year average from 2015-2017 for car charging electricity consumption. The carbon fingerprint is shown in Fig.1. in comparison with previous years and baseline.

Fig.1. The fingerprint of CO2e emissions in 2017, in comparison with previous years and baseline.
Solar Power Generation
The total solar power generation for the year decreased slightly by 45 kWh to 1496 kWh, derived from reading the generation meter, and was well below the five-year average of 1570 kWh. The monthly solar generation data are shown in Fig.2.
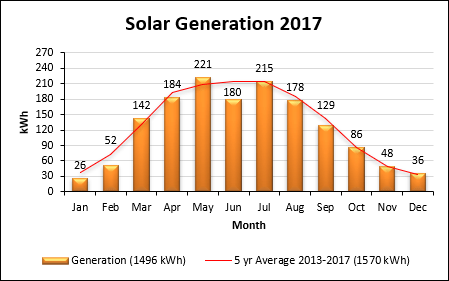
Fig.2. Monthly solar generation data.
Household Electricity Consumption
Total annual household electricity grid consumption was reduced on the previous year by 111 kWh or 9% to 1189 kWh, again derived from reading the electricity meter. This was also below the five-year average. The monthly grid electricity consumption data are shown in Fig.3.
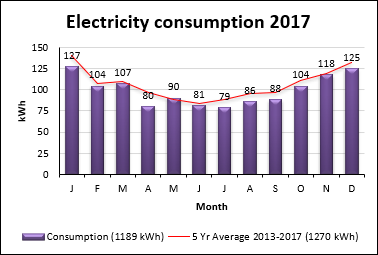
Fig.3. Monthly grid electricity consumption data.
Using the assumption of 25% solar self-consumption, this year, 1189 kWh grid consumption minus 1122 kWh solar export resulted in a net grid electricity consumption of 67 kWh. Grid electricity was given a carbon intensity figure of 0.385 kgCO2e/kWh (DECC, 2017) for a 2017 generation mix. The combined solar self-consumption and exported generation resulted in an emissions reduction of 39 kgCO2e to 26 kgCO2e or 0.03 tCO2e.
Space and Water Heating
Total annual household gas consumption decreased by 18% on the previous year to 4830 kWh, derived from monthly meter readings, shown as a column chart in Fig.4. The chart reveals a warmer Spring season compared to the average and much warmer than the previous year, resulting in the lower-than-average gas consumption. All consumption was provided by the gas grid, and given a carbon intensity figure of 0.205 kgCO2e/kWh (DECC, 2017). This resulted in a decrease of 216kgCO2e to 990 kgCO2e or 1.0 tCO2e emissions.
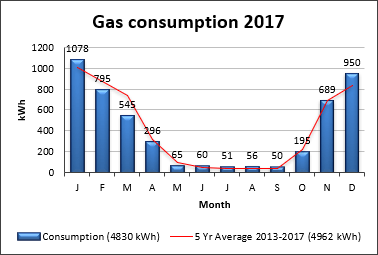
Fig.4. Monthly gas consumption data.
Car Travel
The car in use was a battery electric vehicle (BEV). The annual mileage estimated to the nearest 1000 increased to 14000 miles, or 22000 km. As the fuel is electricity, the carbon intensity figure of fuel production and use in an electric vehicle is the same as is given for grid electricity, which this year was 0.385 kgCO2e/kWh (DECC, 2017) for a 2017 generation mix. The car consumed 3033 kWh of electricity to charge, well above the three-year average, derived from monthly readings of the night time consumption meter and shown as a column chart in Fig.5., resulting in an increase in fuel production emissions only to 1168 kgCO2e or 1.2 tCO2e.
Note: In the units previously given for vehicle emissions, 2017 grid electricity equates to 0.053 kgCO2e/km.

Fig.5. Monthly car charging data.
Water Consumption
Total annual household water consumption remained at 30 m3 derived from a utility bill for that year. The 2017 carbon intensity figure of domestic water supply (0.344 kgCO2e/m3), and treatment (0.708 kgCO2e/m3) is given as 1.052 kgCO2e/m3 (DECC, 2017). This resulted in no change and emissions remained at 0.03 tCO2e.
Lifestyle
Other measures, in addition to reducing carbon emissions, need to be taken to both mitigate and adapt to climate change. When the driveway surface was renewed this year, the ‘Albedo’ or reflectiveness of the surface was considered. The new driveway, Fig.6., is a permeable gravel/resin in a beach sand colour, which not only reflects sunlight and heat, but is also a sustainable drainage system (SuDS) allowing rainwater to penetrate it in heavy rainfall events, alleviating local surface run-off. Whilst this does not reduce carbon and did not affect the results for lifestyle in the carbon footprint calculator (WWF, 2017), maintaining emissions at 0.5 tCO2, it is an important and necessary climate change adaptation for domestic dwellings.

Fig.6. The reflective sustainable drainage system (SuDS) driveway.
Infrastructure
The figure for infrastructure emissions in the carbon footprint calculator (WWF, 2017) remained at 2.75 tCO2 for each UK citizen. The annual donation to the Woodland Trust to plant 25 m2 of woodland, and the 14 trees planted off-set and sequester -1.14 tCO2 of these indirect emissions.
Behaviours
In September of this year, I began a Master’s Degree course in Sustainability in Energy Provision and Demand Management at the Graduate School of the Environment based at the Centre for Alternative Technology and University of East London. All previous behaviours continued, although more time was spent away from home for various reasons.
Conclusions
There was an overall emissions reduction of 4% or 0.2 tCO2e compared to the previous year, and 59% or 6.4 tCO2e compared to the baseline year. This was due to reductions in grid electricity consumption, despite lower solar generation, and in gas consumption, due mostly to a warmer spring, and water consumption remained the same as the previous year. However, vehicle travel emissions increased with an increase in mileage, although this was alleviated somewhat due to a lower emission factor for grid electricity as more renewable generators were again added to the mix. More time spent away from home accounted for the lower electricity consumption, increase in travel mileage, and some of the lower gas consumption.
References
The Department for Energy and Climate Change (2017). Greenhouse gas reporting – Conversion factors 2017. Available at: Greenhouse gas reporting: conversion factors 2017 – GOV.UK (www.gov.uk) (accessed January 2018).
WWF-UK (2018). Available at: WWF Footprint Calculator (accessed January 2018).
