Overview
I graduated this year from the Open University with a BSc Environmental Studies and Diploma in Environmental Policy, as a mature student aged 40. Over the previous three years, the action taken to reduce carbon dioxide emissions in the four main areas of electricity use, space heating and hot water, travel, and lifestyle, resulted in an annual reduction of 43% or 4.6 tCO2e. However, whilst good progress had been made in reducing these direct emissions, there remained a substantial contribution to the footprint from the indirect emissions from infrastructure. These emissions could only be reduced by off-setting, and so it was decided to increase the contribution of natural carbon capture and storage, or sequestration, through planting a further six trees at home and donating money each year to plant a further 25 m2 of woodland. The carbon fingerprint is shown in Fig.1. in comparison with previous years and baseline.
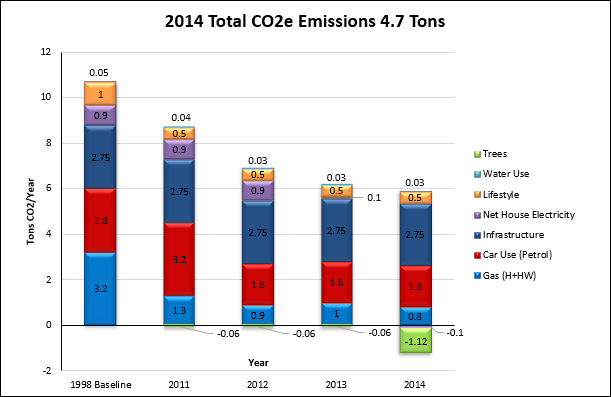
Fig.1. The fingerprint of CO2e emissions in 2014, in comparison with previous years and baseline.
Solar Power Generation
The total solar power generation for the year increased slightly by 16 kWh to 1593 kWh, derived from reading the generation meter. The monthly solar generation data are shown in Fig.2.
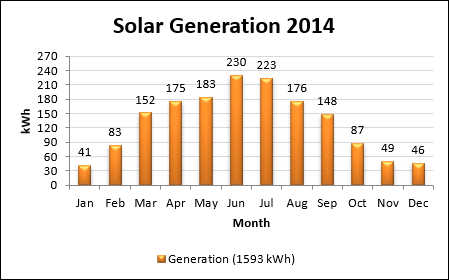
Fig.2. Monthly solar generation data.
Household Electricity Consumption
Total annual household electricity grid consumption was reduced on the previous year by 20% or 271 kWh to 1082 kWh, again derived from reading the electricity meter. The monthly grid electricity consumption data are shown in Fig.3.
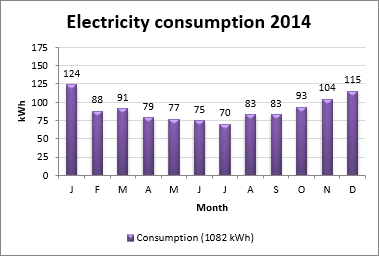
Fig.3. Monthly grid electricity consumption data.
Using the assumption of 25% solar self-consumption, this year 1082 kWh grid consumption minus 1195 kWh solar export resulted in a net grid electricity export of 113 kWh. Grid electricity was given a carbon intensity figure of 0.537 kgCO2e/kWh (DECC, 2014) for a 2014 generation mix. The combined solar self-consumption and exported generation resulted in an emissions reduction on the previous year of 144 kgCO2e to -61 kgCO2e or -0.1 tCO2e.
Space and Water Heating
Due to very mild winter weather conditions, total annual household gas consumption decreased by 20% on the previous year to 4065 kWh, the lowest value so far, derived from monthly meter readings, shown as a column chart in Fig.4. All consumption was provided by the gas grid, and given a carbon intensity figure of 0.206 kgCO2e/kWh (DECC, 2014). This resulted in a decrease of 210kgCO2e to 837 kgCO2e or 0.8 tCO2e emissions.
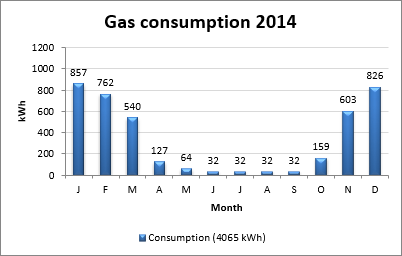
Fig.4. Monthly gas consumption data.
Car Travel
The vehicle in use remained a mid-sized 1.6 litre petrol hybrid. The estimated annual mileage to the nearest 1000 was given as 8000 miles, or 13000 km. The carbon intensity figure of petrol fuel production and use in a hybrid vehicle is given as 0.14 kgCO2e/km (DECC, 2012). This resulted in emissions remaining at 1.8 tCO2e.
Water Consumption
A 300-litre water butt was installed to collect rainwater from the main house roof for later use in the garden, and watering houseplants. Total annual household water consumption was reduced by 11% to 24 m3, derived from a utility bill for that year. The 2014 carbon intensity figure of domestic water supply (0.344 kgCO2e/m3), and treatment (0.709 kgCO2e/m3) is given as 1.053 kgCO2e/m3 (DECC, 2014). This resulted in an emissions reduction of 3 kgCO2e to 25 kgCO2e, holding the fingerprint value at 0.03 tCO2e.
Lifestyle
An extremely inefficient LCD television was replaced with a more efficient LED TV at the beginning of this year. The new TV was Ten-times more efficient, reducing the power output from 350 Watts to just 35 Watts. This was the likely reason for the 20% reduction in grid electricity demand. The old TV was sold to a second-hand store.
My savings were moved to ethical bank Triodos, to ensure my money was only being invested in environmentally and socially positive, sustainable projects. I also became a member and supporter of the Centre for Alternative Technology in Machynlleth, Wales.
These did not affect the results for lifestyle in the carbon footprint calculator (WWF, 2016), so emissions remained at 0.5 tCO2.
Infrastructure
The figure for infrastructure emissions in the carbon footprint calculator (WWF, 2016) remained at 2.75 tCO2 for each UK citizen. Six more trees were planted, some are shown in Fig.5., and money donated annually to the Woodland Trust to plant 25 m2 of woodland to off-set a further 1.06 tCO2 of these infrastructure emissions. Together with the 0.06 tCO2 sequestered each year by the six trees planted in 2011, this resulted in sequestration of -1.12 tCO2 in the fingerprint. This action also has an additional positive effect by increasing biodiversity.
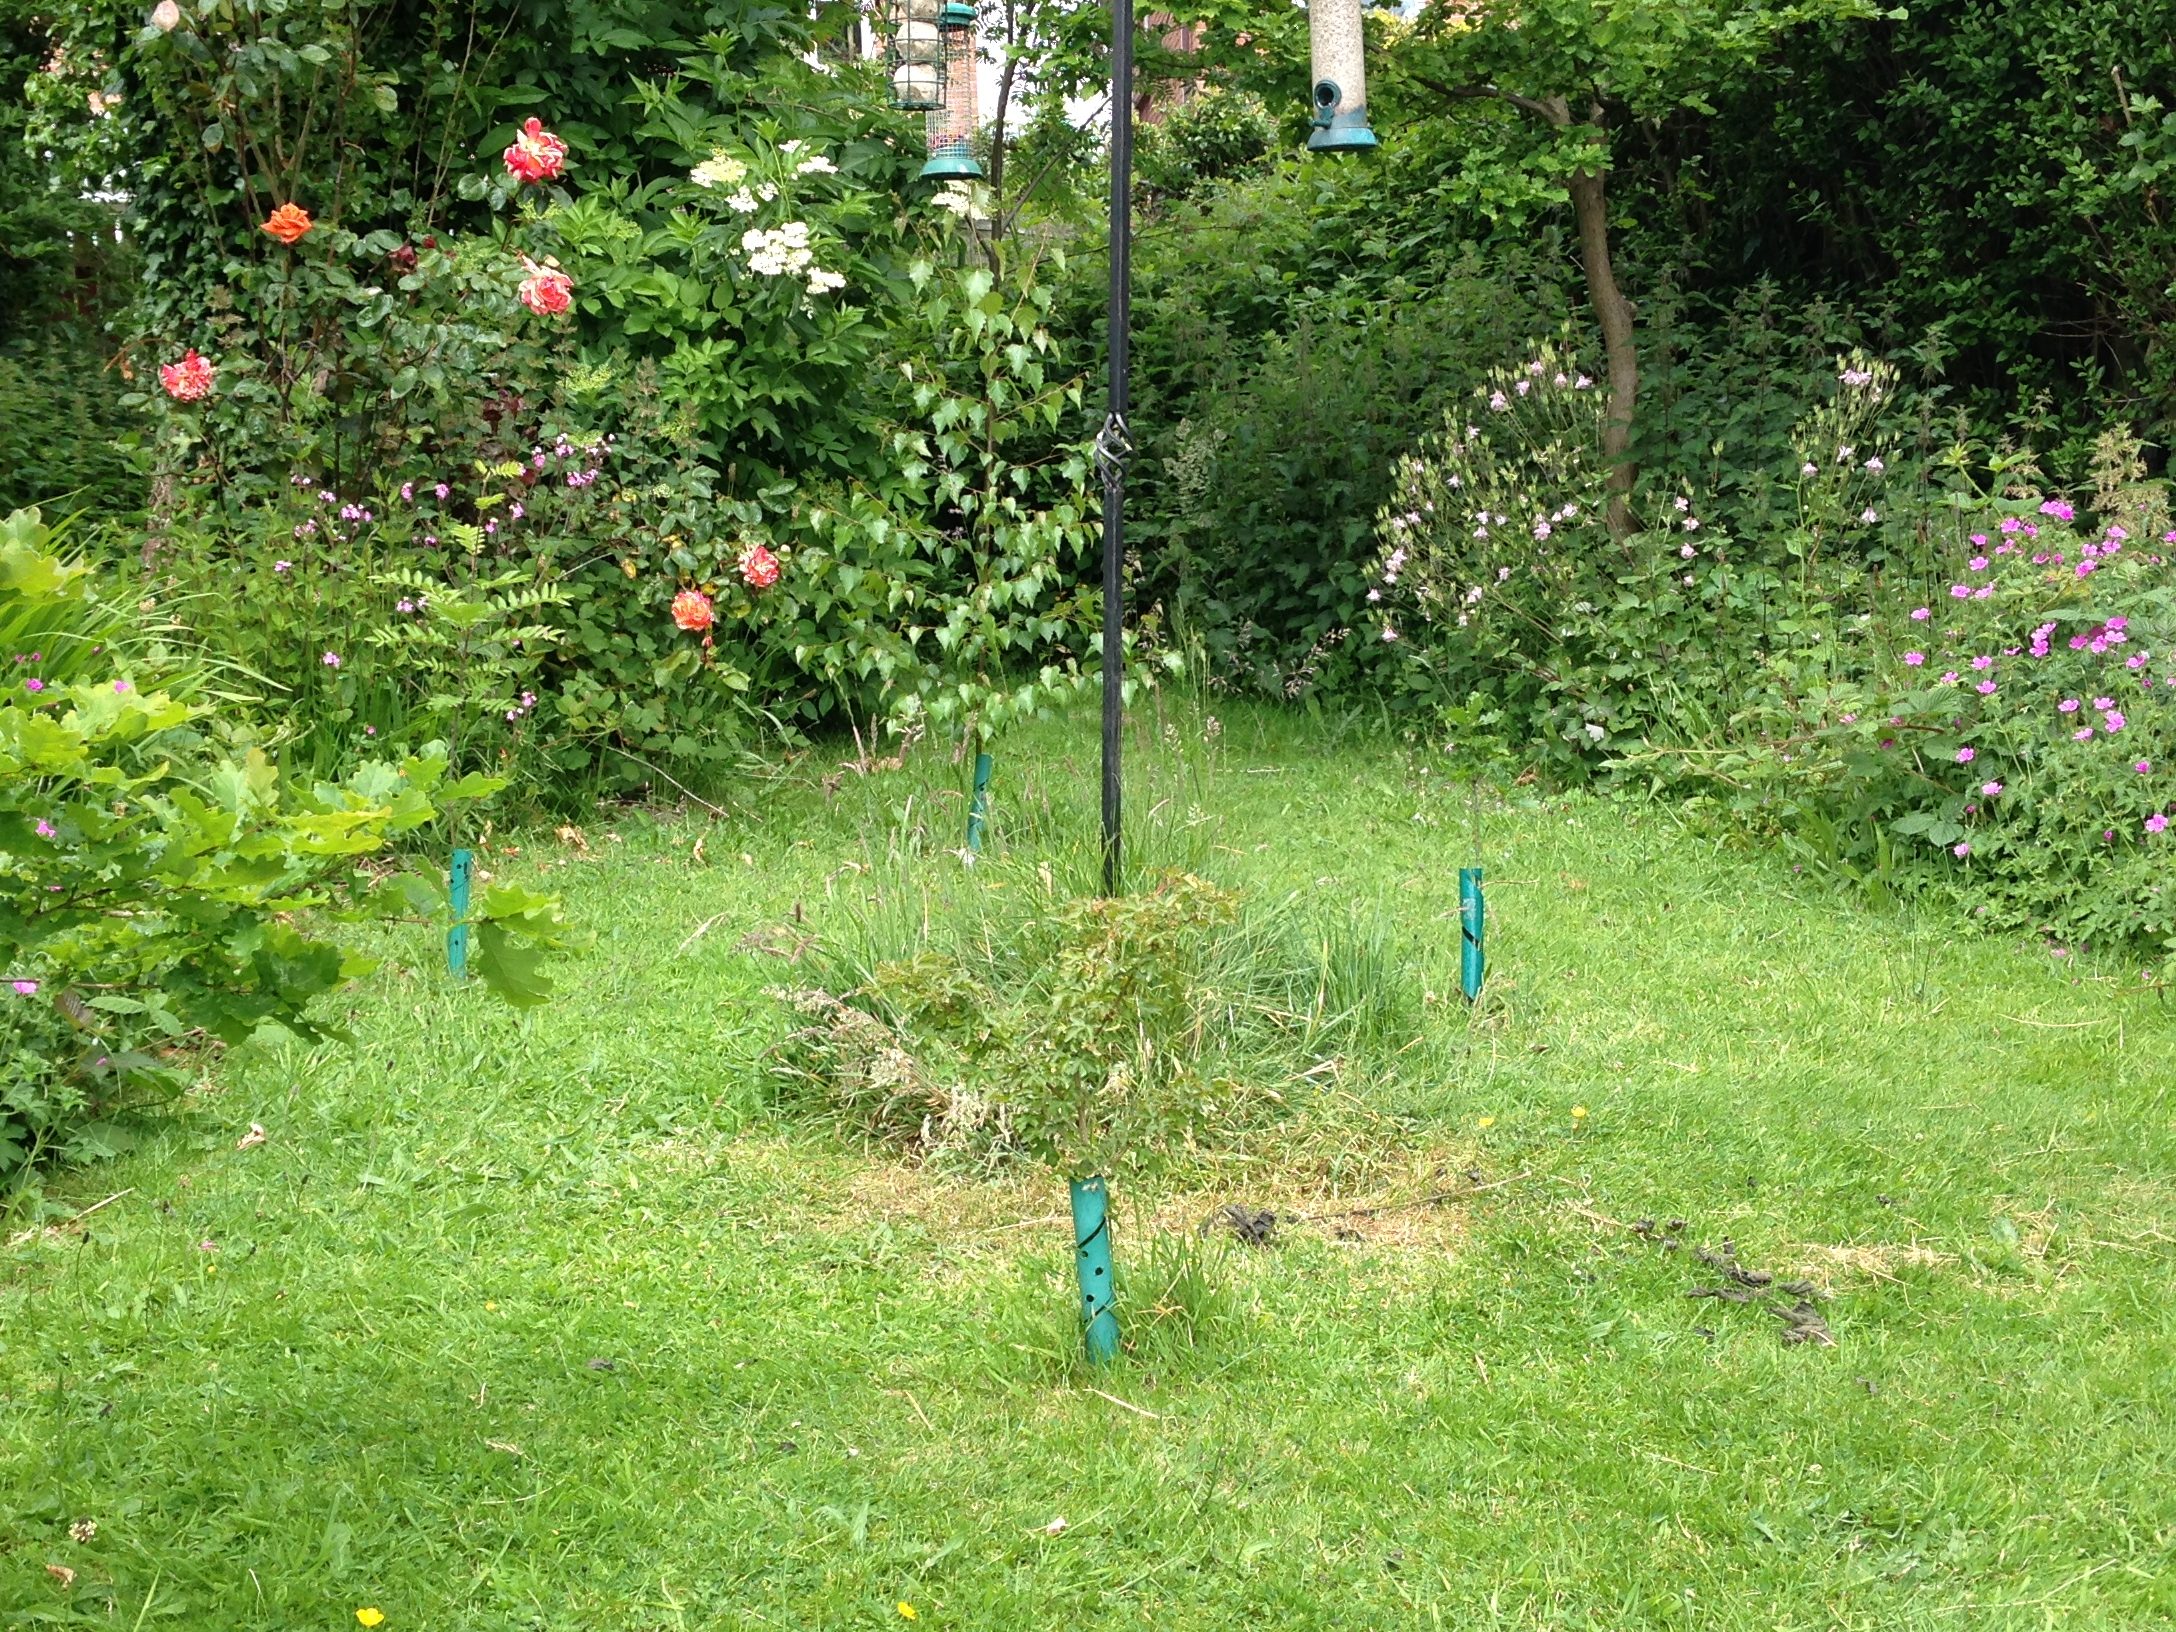
Fig.5. Four of the six newly planted trees. (Clockwise from left) Rowan, Silver Birch, Oak, and Field Maple.
Behaviours
With a new understanding of the electricity grid and my solar generation, I began to change behaviour around electricity use. Making the most of the solar generation by doing clothes washing and using the dishwasher when the solar PV system was producing peak power. I also began delaying cooking my evening meals until 7.30 pm. This reduces carbon emissions by reducing the amount of fossil-fuelled power needed to meet the evening peak electricity demand between 4pm and 7.30pm.
Conclusions
There was an overall emissions reduction of 23% or 1.4 tCO2e compared to the previous year, and 56% or 6 tCO2e compared to the baseline year. This was mostly due to off-set infrastructure emissions of 1.06 tCO2e by natural sequestration from tree planting. Contributions also came from net grid electricity export, and a weather-related decrease in gas consumption further reducing emissions by 0.1 tCO2e and 0.2 tCO2e, respectively. There was a further, slight reduction in water use which does not show in the fingerprint.
References
The Department for Energy and Climate Change (2014). Greenhouse gas reporting – Conversion factors 2014. Available at: https://www.gov.uk/government/publications/greenhouse-gas-reporting-conversion-factors-2014 (accessed 05 August 2016).
The Department for Energy and Climate Change and The Department for Environment, Food and Rural Affairs (2012). 2012 Guidelines to Defra / DECC’s GHG Conversion Factors for Company Reporting. Table 6d. Available at: pb13773-ghg-conversion-factors-2012.pdf (publishing.service.gov.uk) (accessed 05 August 2016).
WWF-UK (2016). Available at: WWF Footprint Calculator (accessed 05 August 2016).
