Overview
With a 41% reduction in carbon emissions per year already achieved from space and water heating, car use, and electrical efficiency, the focus turned to reducing electrical demand from the grid. With the help of a government incentive, the Feed-in-Tariff (FiT), it became financially viable to install a solar system. In November 2012, a 1.8 kWp (kiloWattpeak) solar photovoltaic array was installed on the south-east facing roof of the property, consisting of eight 230-Watt polycrystalline silicon modules. The system was predicted by the installer to produce 1472 kWh of zero-carbon electricity per year, of which approximately one-quarter would be self-consumed, and the rest exported to the grid.
Further improvements to thermal efficiency were also made in September of this year, in the form of A-rated, argon-filled, double-glazed windows with a low emissivity coating which traps heat in and maximises passive solar gain. The carbon fingerprint is shown in Fig.1. in comparison with previous years and baseline.
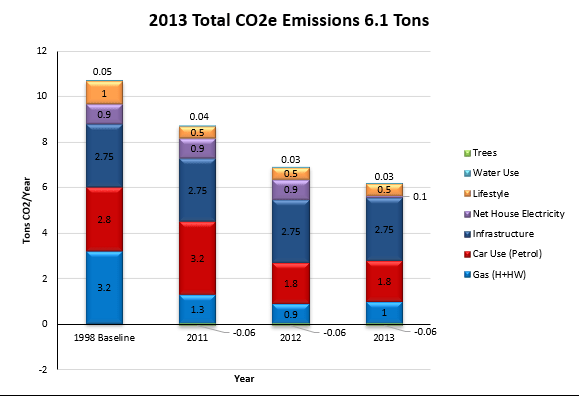
Fig.1. The fingerprint of CO2e emissions in 2013, in comparison with previous years and baseline.
Solar Power Generation
The solar array, shown in Fig.2., reached the predicted generation value on September 22nd, with a full quarter of the year still to go. The total generation for the year was 1577 kWh, derived from reading the generation meter. The monthly solar generation data are shown in Fig.3.
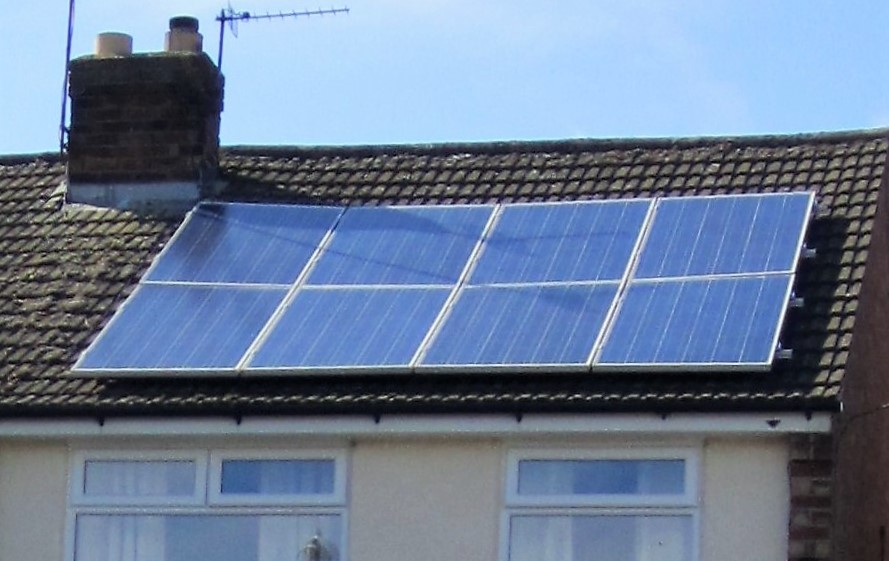
Fig.2. The 1.8 kWp Solar Photovoltaic rooftop array on my home.
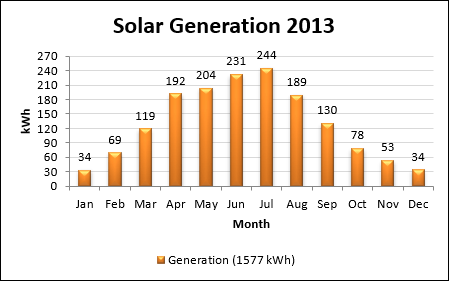
Fig.3. Monthly solar generation data.
Furthermore, the solar PV system installation improved the Energy Performance Certificate (EPC) value from Band C (Rating 73) to Band B (Rating 83), shown in Fig.4.
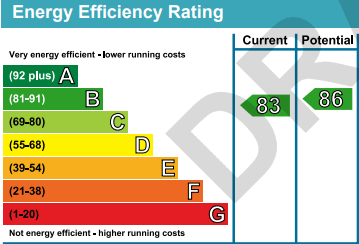
Fig.4. A draft EPC showing the new current energy efficiency rating of the building.
Household Electricity Consumption
Total annual household electricity grid consumption was reduced on the previous year by 23% or 403 kWh to 1353 kWh, again derived from reading the electricity meter. The monthly grid electricity consumption data are shown in Fig.5. However, a new approach was now needed to work out the CO2e emissions.
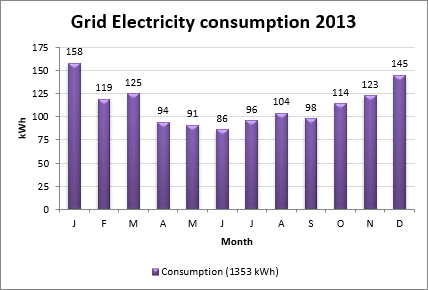
Fig.5. Monthly grid electricity consumption data.
The methodology to determine the net CO2e emissions from electricity use is worked as follows, using the data from this first year of solar generation. The predicted solar self-consumption of 25% of total generation would be 394 kWh, very close to the electricity grid consumption reduction of 403 kWh. Working on the assumptions that overall household electrical demand was similar, but slightly lower, to the previous year, and all electricity grid consumption reduction was a result of solar generation, this then leaves 75% or 1183 kWh of solar generation exported to the grid. This exported generation removes the equivalent amount having to be generated by the electricity grid, off-setting household electricity consumed from the grid, at night for example.
This year, 1353 kWh consumed minus 1183 kWh exported resulted in a net grid electricity consumption of 170 kWh. Grid electricity was given a carbon intensity figure of 0.484 kgCO2e/kWh (DECC, 2013) for a 2013 generation mix. The combined solar self-consumption and exported generation resulted in a 91% emissions reduction compared to the previous pre-solar year of 789 kgCO2e to 82 kgCO2e or 0.1 tCO2e.
Note: This is a very simplified method, and is used because the data sources i.e., meter readings, are very basic. It is however, considered appropriate for the illustrative purposes and scope of this work.
Space and Water Heating
Due to colder winter weather conditions, total annual household gas consumption increased by 17% on the previous year to 5081 kWh, derived from monthly meter readings, despite the thermal improvement of the glazing. The monthly gas consumption data are shown as a column chart in Fig.6., and the effect of the new windows can be seen in the lower gas consumption during the winter months at year end when compared to those at the beginning of the year. All consumption was provided by the gas grid, and given a carbon intensity figure of 0.206 kgCO2e/kWh (DECC, 2012). This resulted in an increase of 153kgCO2e to 1047 kgCO2e or 1.0 tCO2e emissions.
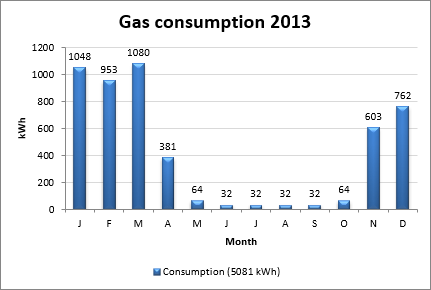
Fig.6. Monthly gas consumption data.
Car Travel
The vehicle in use remained a mid-sized 1.6 litre petrol hybrid. The estimated annual mileage to the nearest 1000 was given as 8000 miles, or 13000 km. The carbon intensity figure of petrol fuel production and use in a hybrid vehicle is given as 0.14 kgCO2e/km (DECC, 2012). This resulted in emissions remaining at 1.8 tCO2e.
Water Consumption
Total annual household water consumption was reduced by 16% to 27 m3, derived from a utility bill for that year. The 2012 carbon intensity figure of domestic water supply (0.344 kgCO2e/m3), and treatment (0.709 kgCO2e/m3) is given as 1.053 kgCO2e/m3 (DECC, 2013). This resulted in a reduction of 6 kgCO2e to 28 kgCO2e, holding the fingerprint value at 0.03 tCO2e emissions.
Lifestyle
The firm providing energy to the home was changed at the beginning of the year, from one of the ‘big six’ to one of the two 100% renewable energy providers in the UK, Good Energy. They would also provide the FiT payments for solar power generation. Although it is a better lifestyle choice to support the building of new renewable energy sources through supporting these suppliers, this did not affect the results for lifestyle in the carbon footprint calculator (WWF, 2016), so emissions remained at 0.5 tCO2.
Infrastructure
The figure for infrastructure emissions in the carbon footprint calculator (WWF, 2016) remained at 2.75 tCO2 for each UK citizen. Again, a value of -0.06 tCO2 was attributed to the natural sequestration of CO2 by the six trees planted in 2011.
Behaviours
Beginning this year, meter readings were now being taken monthly and logged, for solar generation, electricity grid consumption and gas consumption.
Conclusions
There was an overall emissions reduction of 10% or 0.7 tCO2e compared to the previous year, and 43% or 4.6 tCO2e compared to the baseline year. This was exclusively due to reduced emissions of 0.8 tCO2e from net grid electricity consumption, because of solar power generation. A slight weather-related increase in gas consumption reduced the margin by 0.1 tCO2e. There was a further, slight reduction in water use, and a CO2 reducing lifestyle choice that do not show in the footprint.
Importantly, the change to a 100% renewable energy supplier was not used to give a zero-emission factor for electricity grid consumption in the footprint. It was decided, using the yearly emission factors of the mix of generation provided a true representation of CO2 emissions in this category.
References
The Department for Energy and Climate Change (2013). Greenhouse gas reporting – Conversion factors 2013. Available at: https://www.gov.uk/government/publications/greenhouse-gas-reporting-conversion-factors-2013 (accessed 05 August 2016)
The Department for Energy and Climate Change and The Department for Environment, Food and Rural Affairs (2012). 2012 Guidelines to Defra / DECC’s GHG Conversion Factors for Company Reporting. Table 6d. Available at: pb13773-ghg-conversion-factors-2012.pdf (publishing.service.gov.uk) (accessed 05 August 2016).
WWF-UK (2016). Available at: WWF Footprint Calculator (accessed 05 August 2016).
