Overview
The measures implemented by the end of 2011 are achievable in most homes, especially with funding from government, and this demonstrates that just implementing the less expensive measures can achieve a 20% reduction in carbon emissions. To put this in context, the UK national carbon emission reduction target by 2020 under the Kyoto protocol and EU emission target was 20% below the 1990 baseline year (UNFCCC, 2012).
However, the carbon fingerprint highlights there were further reductions to be made. With the lowest cost measures having been taken to reduce emissions from the property, with significant effect, it was time to focus on reducing travel emissions. The carbon fingerprint is shown in Fig.1. in comparison with the previous year and baseline.
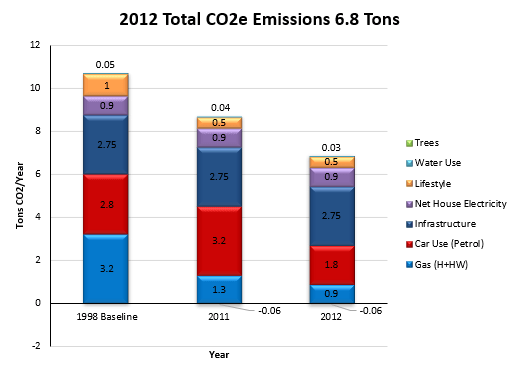
Fig.1. The fingerprint of CO2e emissions in 2012, in comparison with the previous year and baseline.
Household Electricity Consumption
Total annual household electricity consumption slightly increased on the previous year by 1% to 1756 kWh, derived from a utility bill for that year. All consumption was provided by the electricity grid and given a carbon intensity figure of 0.496 kgCO2e/kWh (DECC, 2013) for a 2012 generation mix. This resulted in an increase of 17 kgCO2e to 871 kgCO2e, holding the fingerprint value at 0.9 tCO2e emissions.
Space and Water Heating
No further improvements to thermal efficiency were made this year. However, due to milder winter weather conditions and less hot water demand, total annual household gas consumption was reduced by 29% on the previous year to 4342 kWh, derived from a utility bill for that year. All consumption was provided by the gas grid and given a carbon intensity figure of 0.206 kgCO2e/kWh (DECC, 2012). This resulted in a reduction of 368 kgCO2e to 894 kgCO2e or 0.9 tCO2e emissions.
An Energy Performance Certificate (EPC) survey was undertaken in October of this year to provide a value of energy performance for the building. This was needed in preparation for a solar PV system installation. The result was a value of Band C (Rating 73), shown in Fig.2.

Fig.2. The EPC showing the current energy efficiency rating of the building.
Car Travel
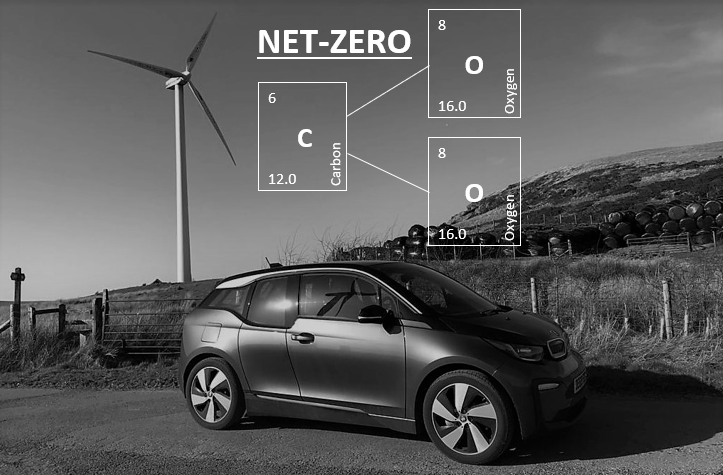
At the end of 2011, the vehicle in use was changed to a mid-sized 1.6 litre petrol hybrid, pictured in Fig.3. With the new breed of battery electric vehicles still in their infancy, and prohibitively expensive, this was the best option at the time. The estimated annual mileage to the nearest 1000 was given as 8000 miles, or 13000 km. The carbon intensity figure of petrol fuel production and use in a hybrid vehicle is given as 0.14 kgCO2e/km (DECC, 2012). This resulted in a 44% reduction of 1417 kgCO2e to 1820 kgCO2e or 1.8 tCO2e emissions.
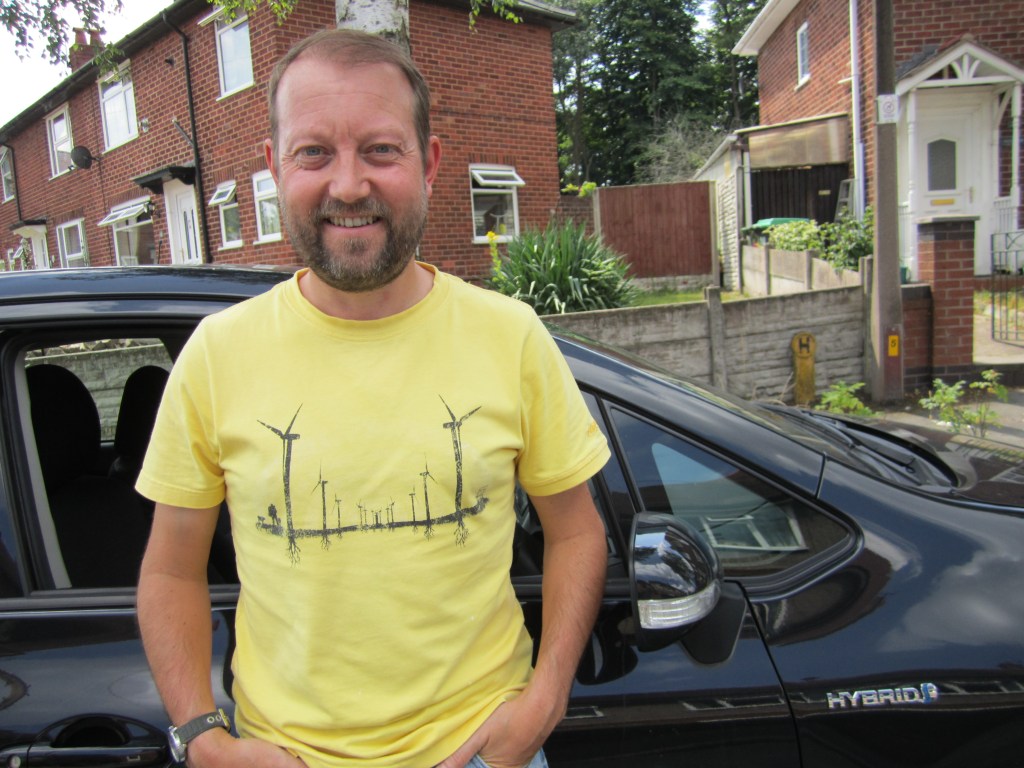
Fig.3. Myself with the Toyota Auris petrol hybrid car.
Water Consumption
This year a water meter was installed at the property. Total annual household water consumption was reduced by 16% to 32 m3, derived from a utility bill for that year. The 2012 carbon intensity figure of domestic water supply (0.344 kgCO2e/m3), and treatment (0.709 kgCO2e/m3) is given as 1.053 kgCO2e/m3 (DECC, 2013). This resulted in a reduction of 6 kgCO2e to 34 kgCO2e or 0.03 tCO2e emissions.
Lifestyle
There were no changes to the previous year, so emissions remained at 0.5 tCO2.
Infrastructure
The figure for infrastructure emissions in the carbon footprint calculator (WWF, 2016) remained at 2.75 tCO2 for each UK citizen, and a value of -0.06 tCO2 was attributed to the natural sequestration of CO2 by the six trees planted in 2011.
Behaviours
Occupancy remained the same as the previous year, however more vigilance was observed with water use, with the installation of the water meter. This clearly reduced water use, but also reduced gas consumption for water heating, as showers were now taken more often than a bath.
Conclusions
There was an overall emissions reduction of 21% or 1.8 tCO2e compared to the previous year, and 41% or 3.9 tCO2e compared to the baseline year. This was primarily due to reduced car-fuel consumption, from the decreased emission factor in the production and use of petrol in a hybrid drivetrain vehicle. The difference between a two-litre petrol car compared to a 1.6 litre hybrid car was an impressive 1.4 tCO2e/year when driving the same mileage. There was a further contribution from reduced gas consumption, although this was mostly weather related, and another small contribution from reduced water use.
References
The Department for Energy and Climate Change (2013). Greenhouse gas reporting – Conversion factors 2012. Available at: https://www.gov.uk/government/publications/greenhouse-gas-reporting-conversion-factors-2012
The Department for Energy and Climate Change and The Department for Environment, Food and Rural Affairs (2012). 2012 Guidelines to Defra / DECC’s GHG Conversion Factors for Company Reporting. Table 6d. Available at: pb13773-ghg-conversion-factors-2012.pdf (publishing.service.gov.uk) (accessed 05 August 2016).
WWF-UK (2016). Available at: WWF Footprint Calculator (accessed 05 August 2016).
UNFCCC (2012). Doha Amendment to The Kyoto Protocol Doha, 8 December 2012. Available at: Microsoft Word – wtp1356369662324.doc (un.org) (accessed 04 November 2022).
