Overview
In 2010, I decided to begin making the transition from business-as-usual to a low-carbon, sustainable existence. It was then, and still remains, important to do this to try to mitigate the worst effects of human-caused climate change, the biggest threat to humanity and all life on Earth, to be part of the solution, and one less part of the problem. To achieve this, we can reduce the carbon dioxide emissions from our activities by focussing on four areas: space and water heating, electricity consumption, transport, and lifestyle. We can also reduce our impact on natural systems by reducing water use, planting trees, and increasing green space for biodiversity.
Setting a baseline
It would be nice to live in a zero-carbon eco-house, built for the purpose of living a reduced carbon-emitting lifestyle. However, the reality is that most of us will have to work with what we already have, in this case a 1960’s three-bedroom semi-detached house. The first step is to understand exactly what our energy usage is. This can be done through a combination of looking at old utility bills, and taking meter readings for electricity, gas, and water; the mpg consumption and annual mileage of a car; and using data from a carbon footprint calculator for lifestyle and infrastructure values. Through this process and using Carbon Dioxide (CO2) emission factors from reliable sources, a representation of the CO2 fingerprint and total footprint can be formed for a baseline year to measure improvements against, in my case this was 1998, shown in Fig.1.
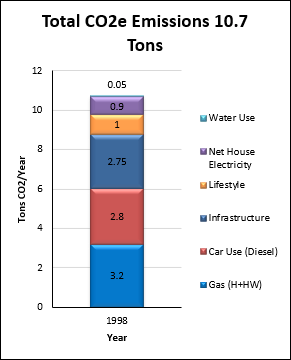
Fig.1. The fingerprint of CO2e emissions in the 1998 baseline year.
Notes:
The emission factors are given as kgCO2e (kilograms carbon dioxide equivalent) which include emissions of carbon dioxide (CO2), methane (CH4) and nitrous oxide (N2O), except those from the WWF carbon footprint calculator.
The emission factors were updated, and WWF carbon footprint calculator values added in 2016.
Household Electricity Consumption
The lights in the house at that time used incandescent bulbs. Appliances were relatively new and had the efficiencies of their time. There was no home computer, tumble dryer, or dishwasher, but apart from those the home had all the usual electrical appliances needed for it to function.
Total annual household electricity consumption was 1771 kWh (kiloWatt hours), derived from an old utility bill from that year. All consumption was provided by the electricity grid and given a carbon intensity figure of 0.519 kgCO2e/kWh for a 1998 generation mix (DECC, 2012). This resulted in 919 kg or 0.9 tCO2e emissions.
Space and Water Heating
This was provided by a 1970’s gas-fired central heating boiler and radiators, very inefficient by modern standards. This was also not a thermally efficient building. There was a thin 2 cm vermiculite insulation layer in the loft, no cavity wall insulation, 1980’s double-glazed aluminium framed windows and patio doors, and leaky wooden front and side doors. Hot water was provided by the boiler on demand.
Total annual household gas consumption was 15704 kWh, again derived from an old utility bill from that year. All consumption was provided by the gas grid and given a carbon intensity figure of 0.206 kgCO2e/kWh (DECC, 2012). This resulted in 3235 kg or 3.2 tCO2e emissions.
Car Travel
The vehicle in use was a mid-sized 1.9 litre diesel. The estimated annual mileage to the nearest 1000 was given as 8000 miles, or 13000 km. The carbon intensity figure of diesel fuel production and use is given as 0.213 kgCO2e/km (DECC, 2012). This resulted in 2769 kg or 2.8 tCO2e emissions.
Water Consumption
At this time there was no water meter installed at the property. Total annual household water consumption was 50 m3, again derived from an old utility bill from that year. The carbon intensity figure of domestic water supply (0.276 kgCO2e/m3), and treatment (0.693 kgCO2e/m3) is given as 0.969 kgCO2e/m3 (DECC, 2012). This resulted in 48 kg or 0.05 tCO2e emissions.
Note: These figures relate to 2007/2008, as the nearest year available.
Lifestyle
These emissions come from our lifestyle choices such as type, consumption, production, and origin of goods like clothes, devices, food and energy, and the ethics or Corporate Social Responsibility (CSR), also known as Environmental, Social and Governance (ESG) of companies we use to provide these.
This figure was derived from an online carbon footprint calculator by the World Wildlife Fund (WWF, 2016), whereby a figure is given depending on the inputs we give as to our lifestyle choices. More environmental and ethical choices give a lower score. A figure was given for a low consumption lifestyle but with few conscious decisions around ethics and low-impact diet. This resulted in 1 tCO2 emissions.
Infrastructure
The infrastructure we use like services, roads, hospitals etc., also have CO2 emissions attributed to them. The major difference with these emissions compared to the other components is that they are not personally controllable, and therefore remain constant over the monitoring period. Infrastructure processes are generally carbon intensive, with little room to reduce the associated emissions. They are attributed to everyone as a proportion of the total emissions for the whole of the UK. The figure was derived from the same carbon footprint calculator (WWF, 2016), and results in 2.75 tCO2 for each UK citizen.
Behaviours
During the baseline year, occupancy was extremely low, with me being out at work for most of the day during the week, and at leisure at weekends. This resulted in very low consumption of electricity and gas for space heating. Flight emissions would have been considered here had any flights been taken, but none were in the baseline year or over the monitoring period. In fact, I have not taken any flights since 2001, but consciously none since 2010 due to the climate impacts.
Conclusions
The rounded total emissions figure of 11 tCO2 for the baseline year is relatively low for a household. However, this household is single occupancy, and remains so right through the monitoring period. It is, therefore, more of an individual footprint in this case, but the methods apply to a household and can be used as such. The baseline highlights the areas for improvement, notably gas, car fuel and electricity consumption emissions, although all areas can and will be improved.
References
1. The Department for Energy and Climate Change and The Department for Environment, Food and Rural Affairs (2012). 2012 Guidelines to Defra / DECC’s GHG Conversion Factors for Company Reporting. Table 3c. Available at: pb13773-ghg-conversion-factors-2012.pdf (publishing.service.gov.uk) (accessed 05 August 2016).
2. The Department for Energy and Climate Change and The Department for Environment, Food and Rural Affairs (2012). 2012 Guidelines to Defra / DECC’s GHG Conversion Factors for Company Reporting. Table 1d. Available at: pb13773-ghg-conversion-factors-2012.pdf (publishing.service.gov.uk) (accessed 05 August 2016).
3. The Department for Energy and Climate Change and The Department for Environment, Food and Rural Affairs (2012). 2012 Guidelines to Defra / DECC’s GHG Conversion Factors for Company Reporting. Table 6c. Available at: pb13773-ghg-conversion-factors-2012.pdf (publishing.service.gov.uk) (accessed 05 August 2016).
4. The Department for Energy and Climate Change and The Department for Environment, Food and Rural Affairs (2012). 2012 Guidelines to Defra / DECC’s GHG Conversion Factors for Company Reporting. Table 9a. Available at: pb13773-ghg-conversion-factors-2012.pdf (publishing.service.gov.uk) (accessed 05 August 2016).
5. WWF-UK (2016). Available at: WWF Footprint Calculator (accessed 05 August 2016).
